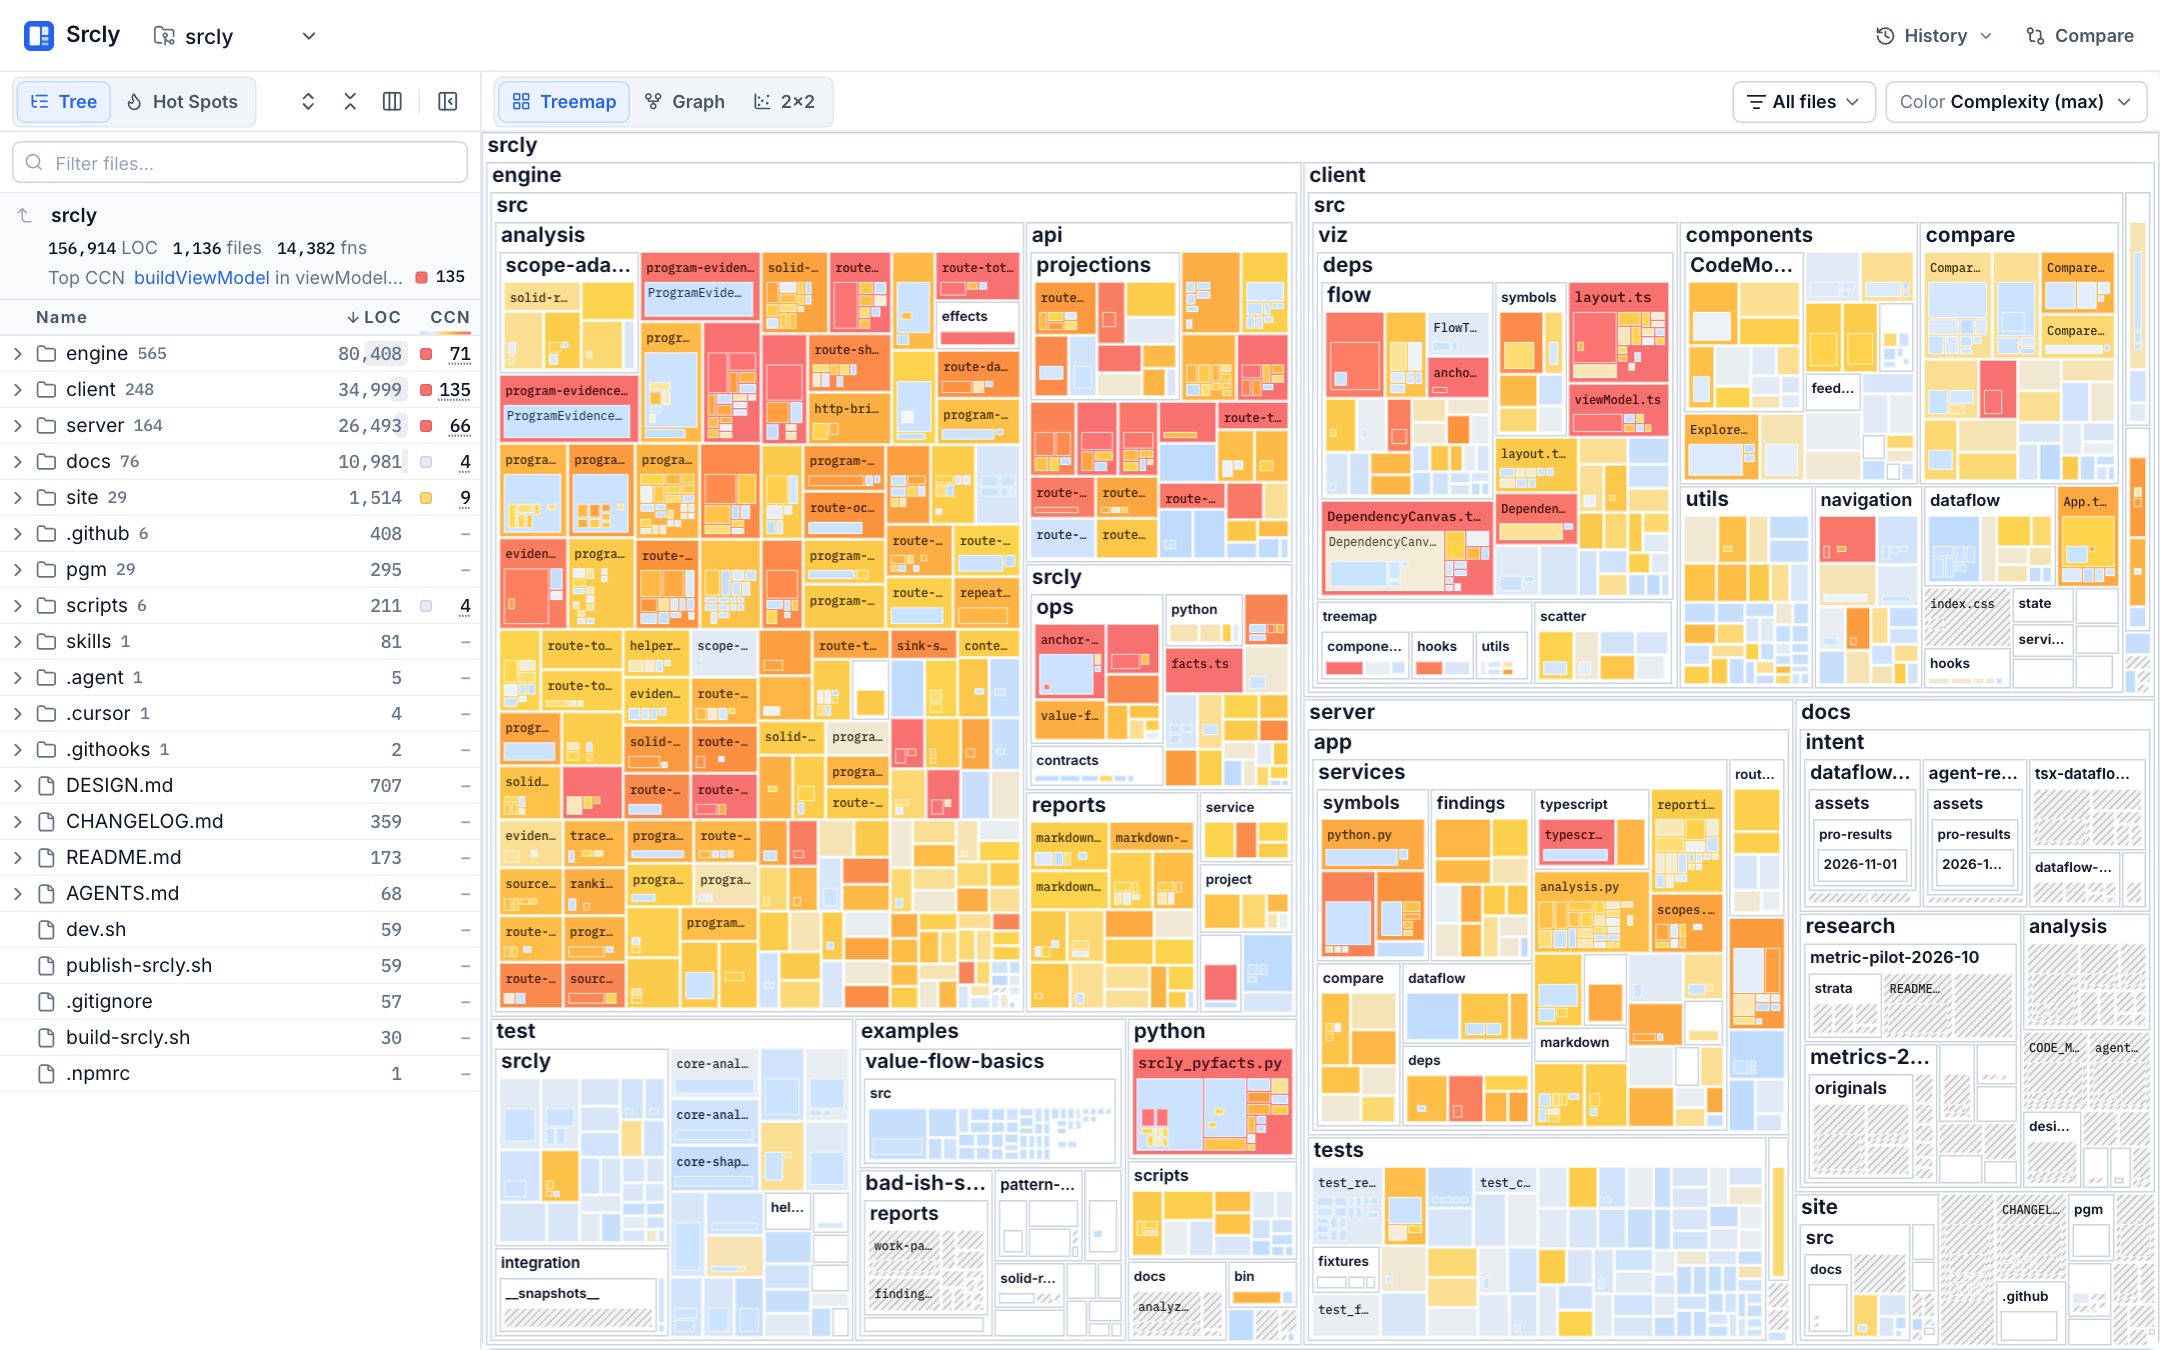
Treemap and explorer
The explorer on the left is the same tree as the map, with sortable columns for LOC, complexity and the other metrics. A folder row shows its file count, and the header names the most complex function below it.
Srcly maps a repository into folders, files, functions and nested scopes, then colors the map by the metric you pick. Start with the whole tree, then open the code behind a signal.
Runs on your machine. No account and no upload.
Version 1.12.0. Full analysis for TypeScript, JavaScript and Python; size and complexity for Go, Java, C, C++ and every other language Lizard reads.
Srcly is a Python package that you run with uv. Nothing is installed globally. It needs Python 3.13 or newer, and uv gets that for you if it is missing.
uvx srcly
uvx srcly .
uvx srcly ~/code/app
With no path, Srcly walks up to the enclosing Git root. Pass . to scan only the current folder, or give any path.
Srcly starts a local server on 127.0.0.1 with a free port and opens your browser. --port and --host change that. Keep the terminal open. Ctrl+C stops it.
The path bar at the top picks another folder. Recent folders stay in the menu.
The first scan shows live progress per file. Srcly saves the result in your user cache folder, never in the repository. When you open an unchanged repository again, it loads at once. Any file change starts a fresh scan.
Srcly's own repository, 1,136 files, scans in about ten seconds on a laptop.
Optional: data flow needs Node.js 18 or newer on PATH. Lint and type checks use the project's own tsc and eslint when node_modules has them, and the bundled ruff for Python. Full setup guide
Every rectangle is a piece of code, and every piece sits inside its parent. A folder holds files, a file holds functions, and a function holds its nested scopes.
client/src from the same scan. Each tile is a file; its color is its most complex function.(body) tile, so a line is never counted twice.One scan feeds every view. They share the metric model, the location in the URL, and the browser's Back button.
The explorer on the left is the same tree as the map, with sortable columns for LOC, complexity and the other metrics. A folder row shows its file count, and the header names the most complex function below it.
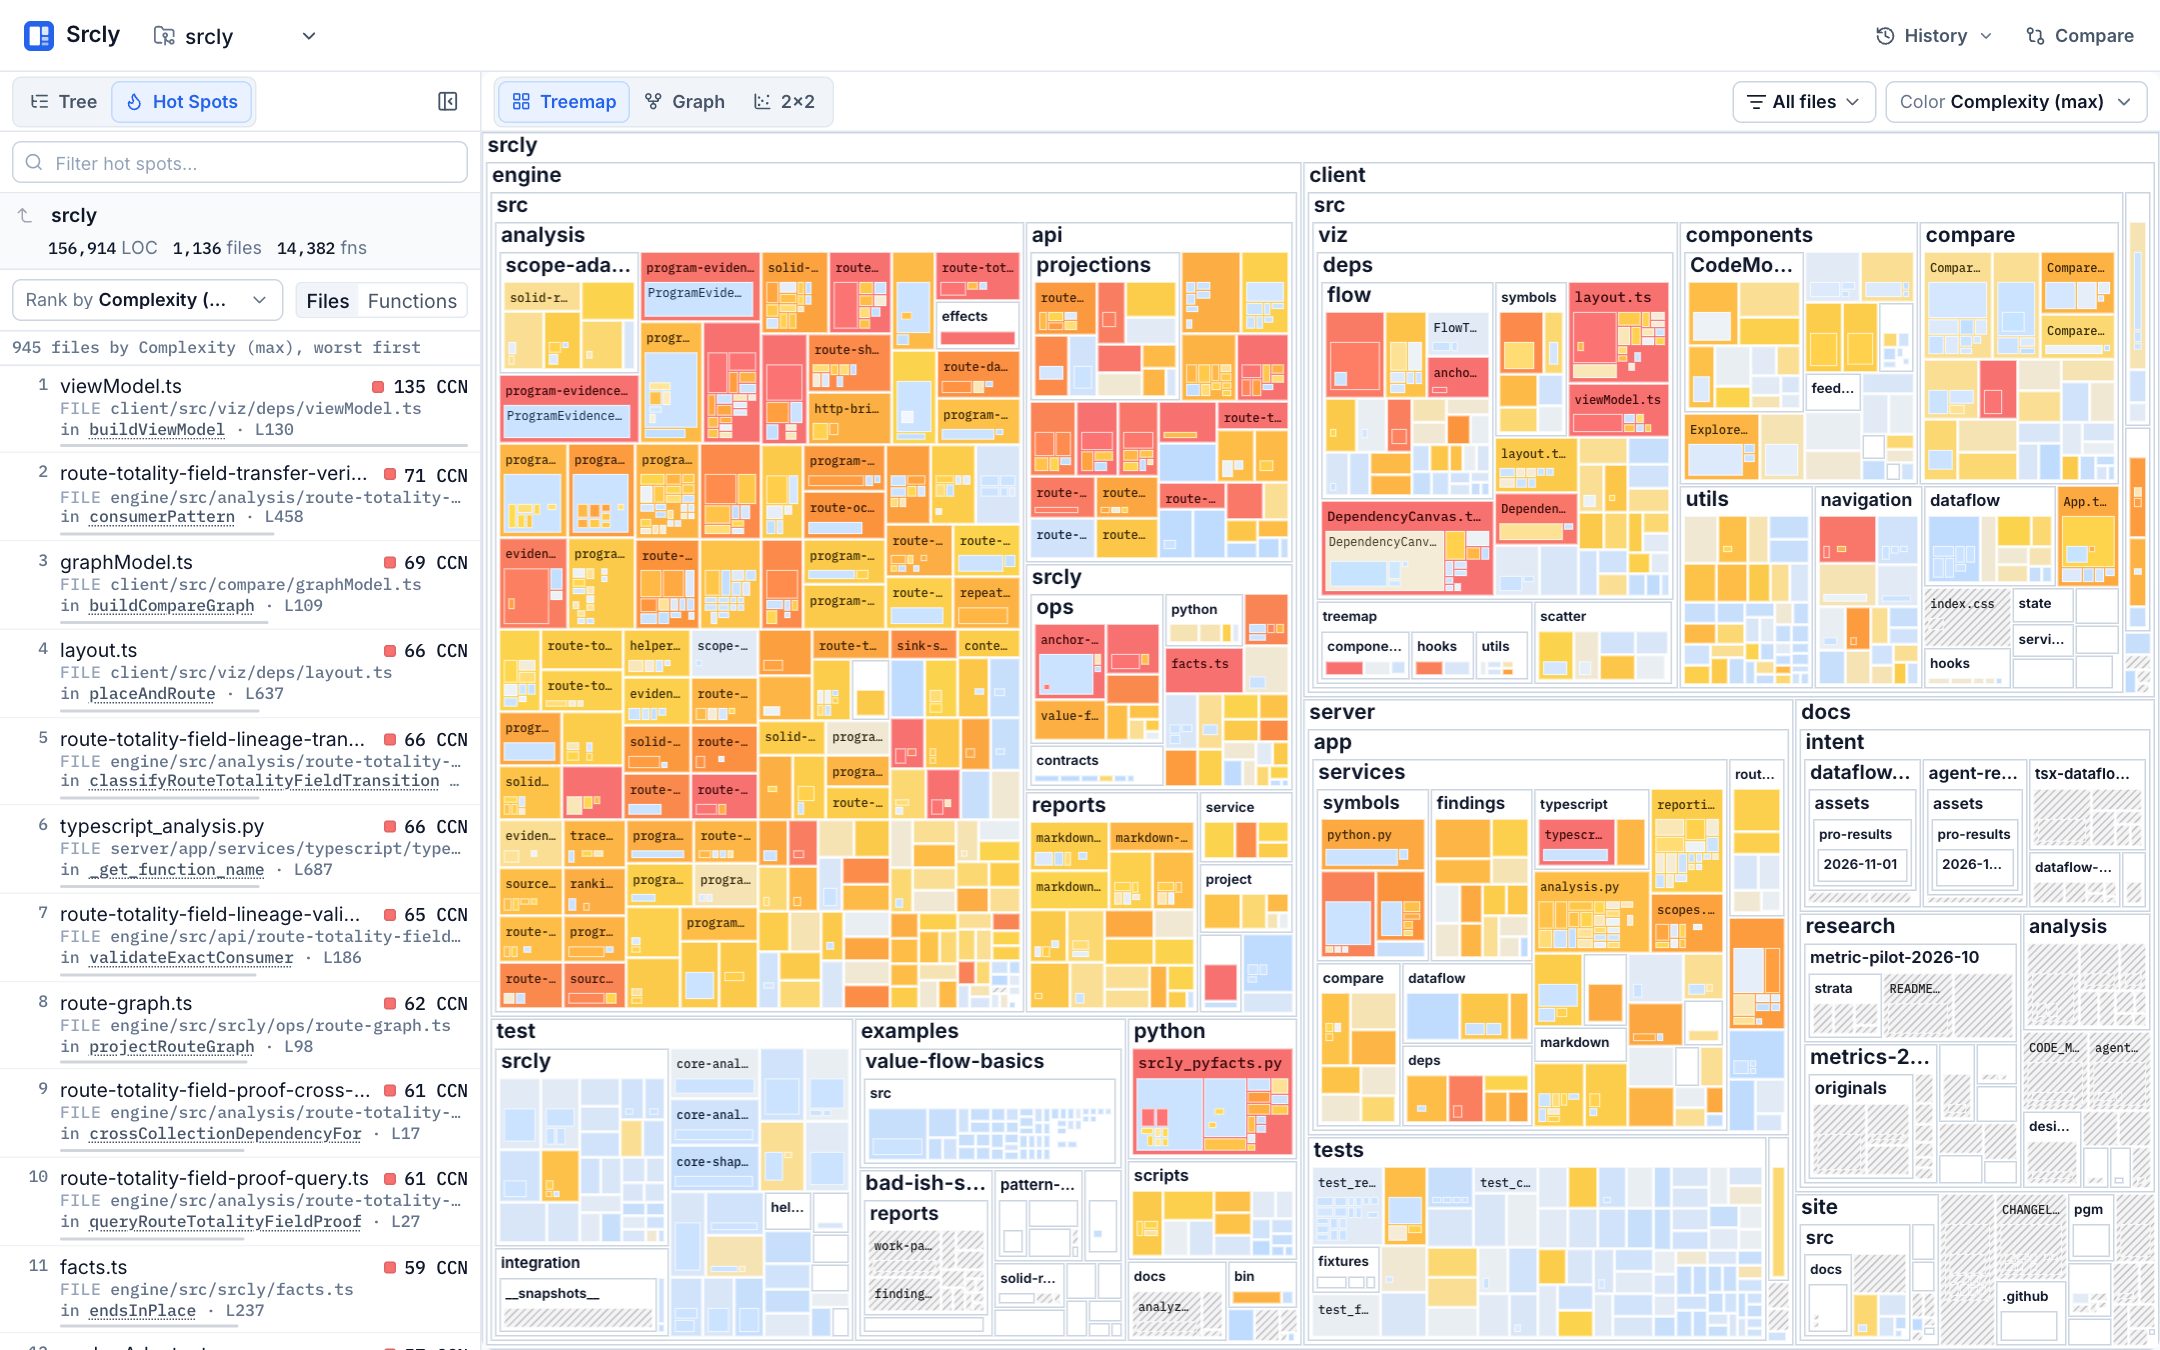
Ranks files and scopes worst first by one or more metrics you pick. N/A rows sit in their own group, because they can't be ranked. Click a row to open its source.
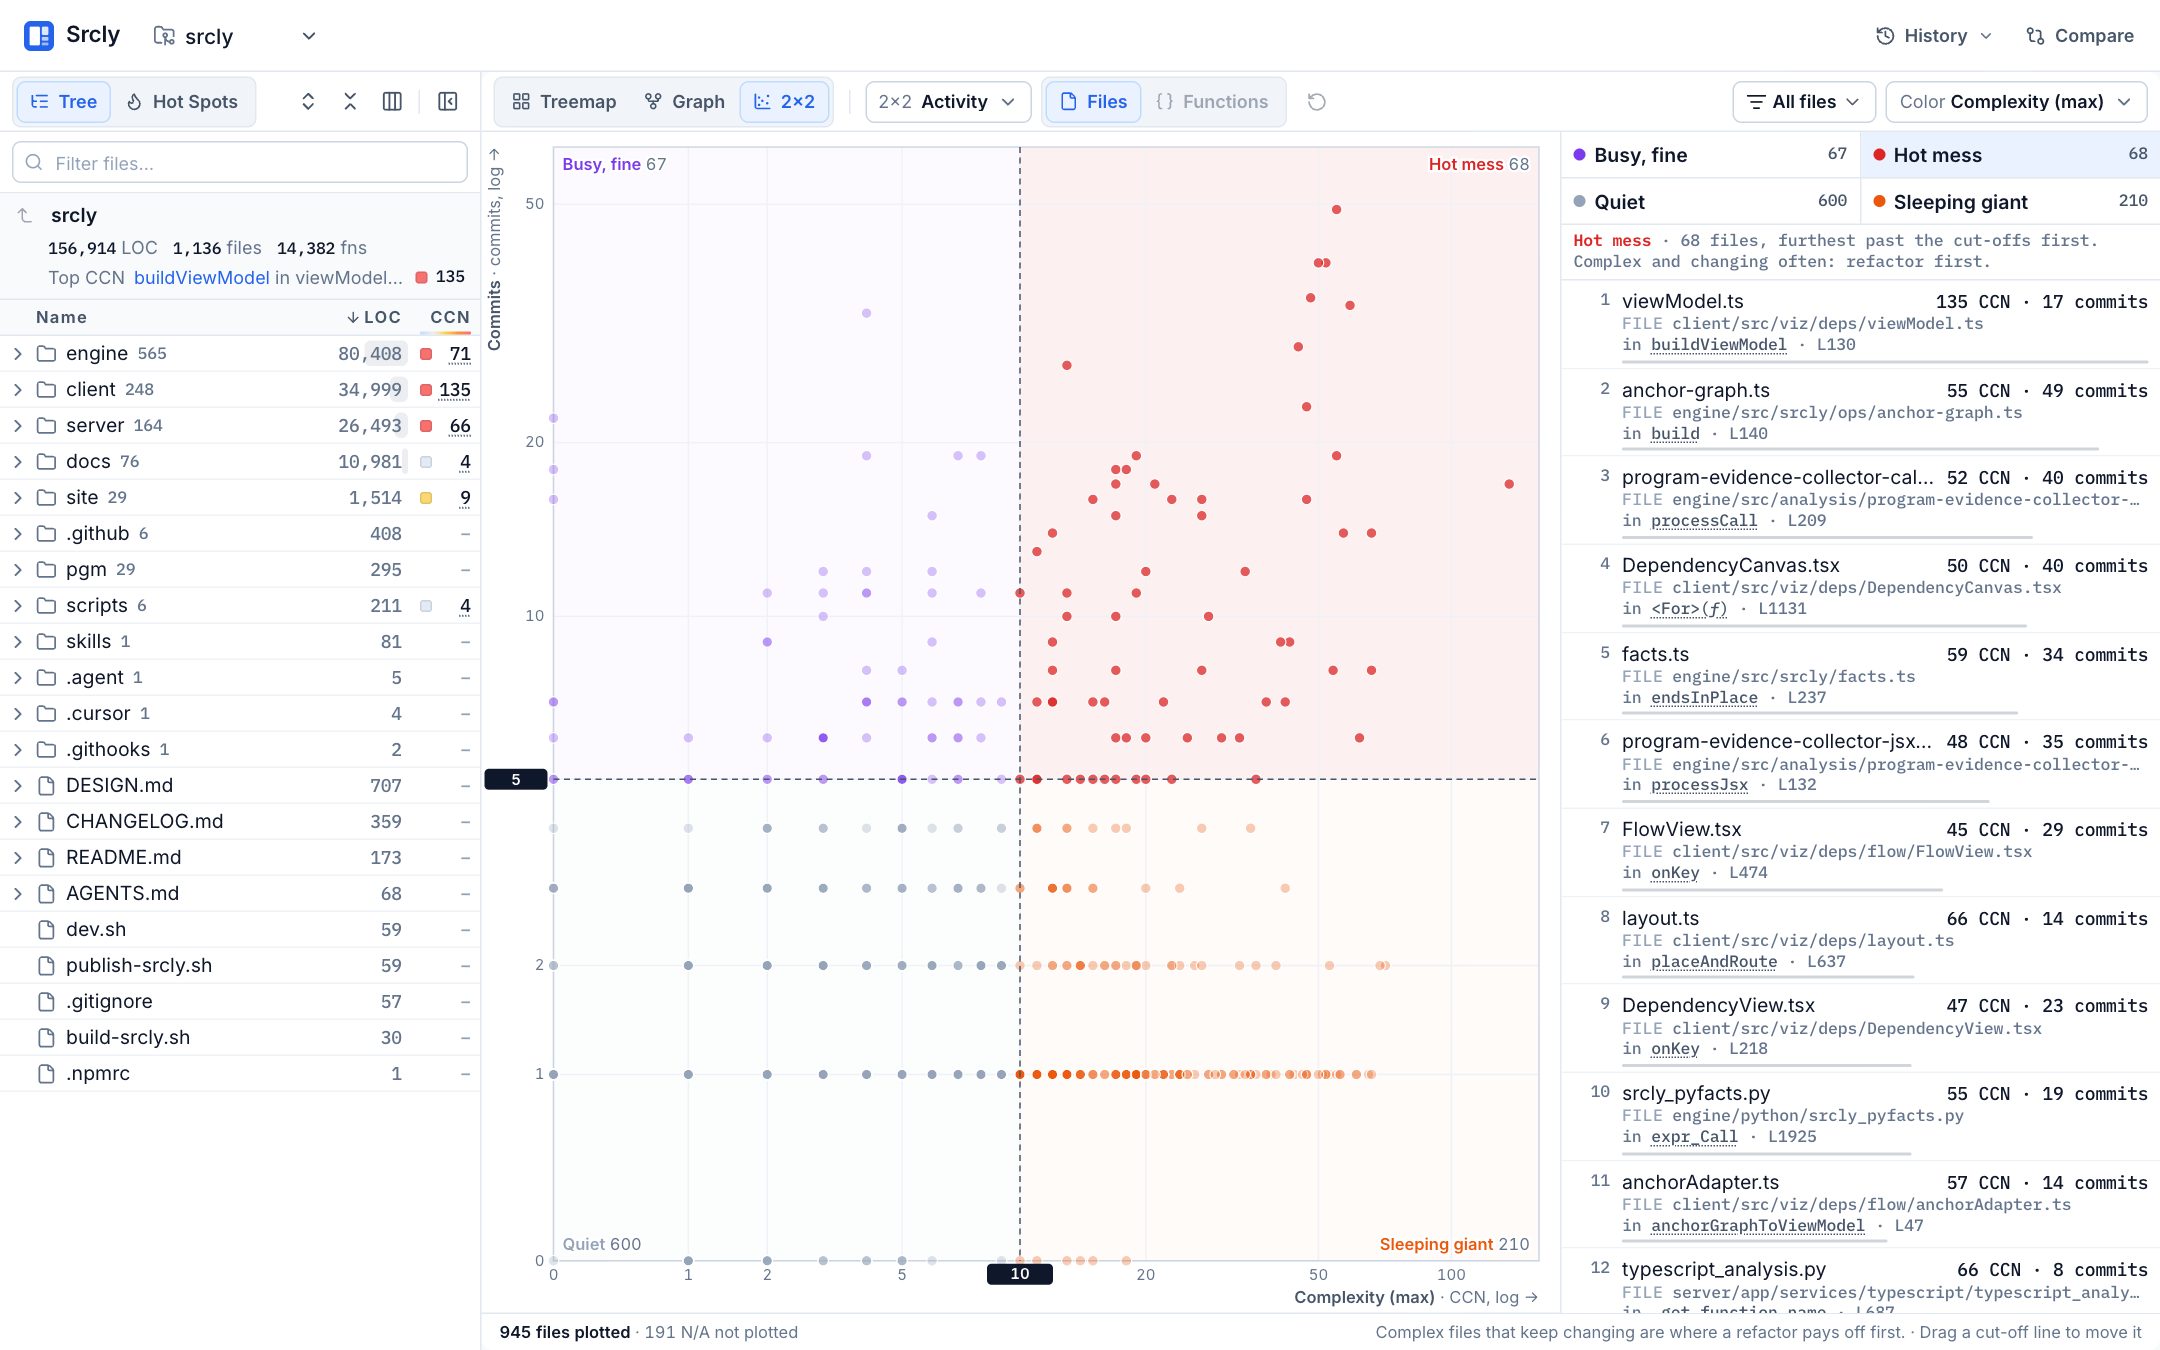
Plots two metrics against each other and names the four quadrants. Drag a cut-off line to move items between quadrants. The 5 presets:
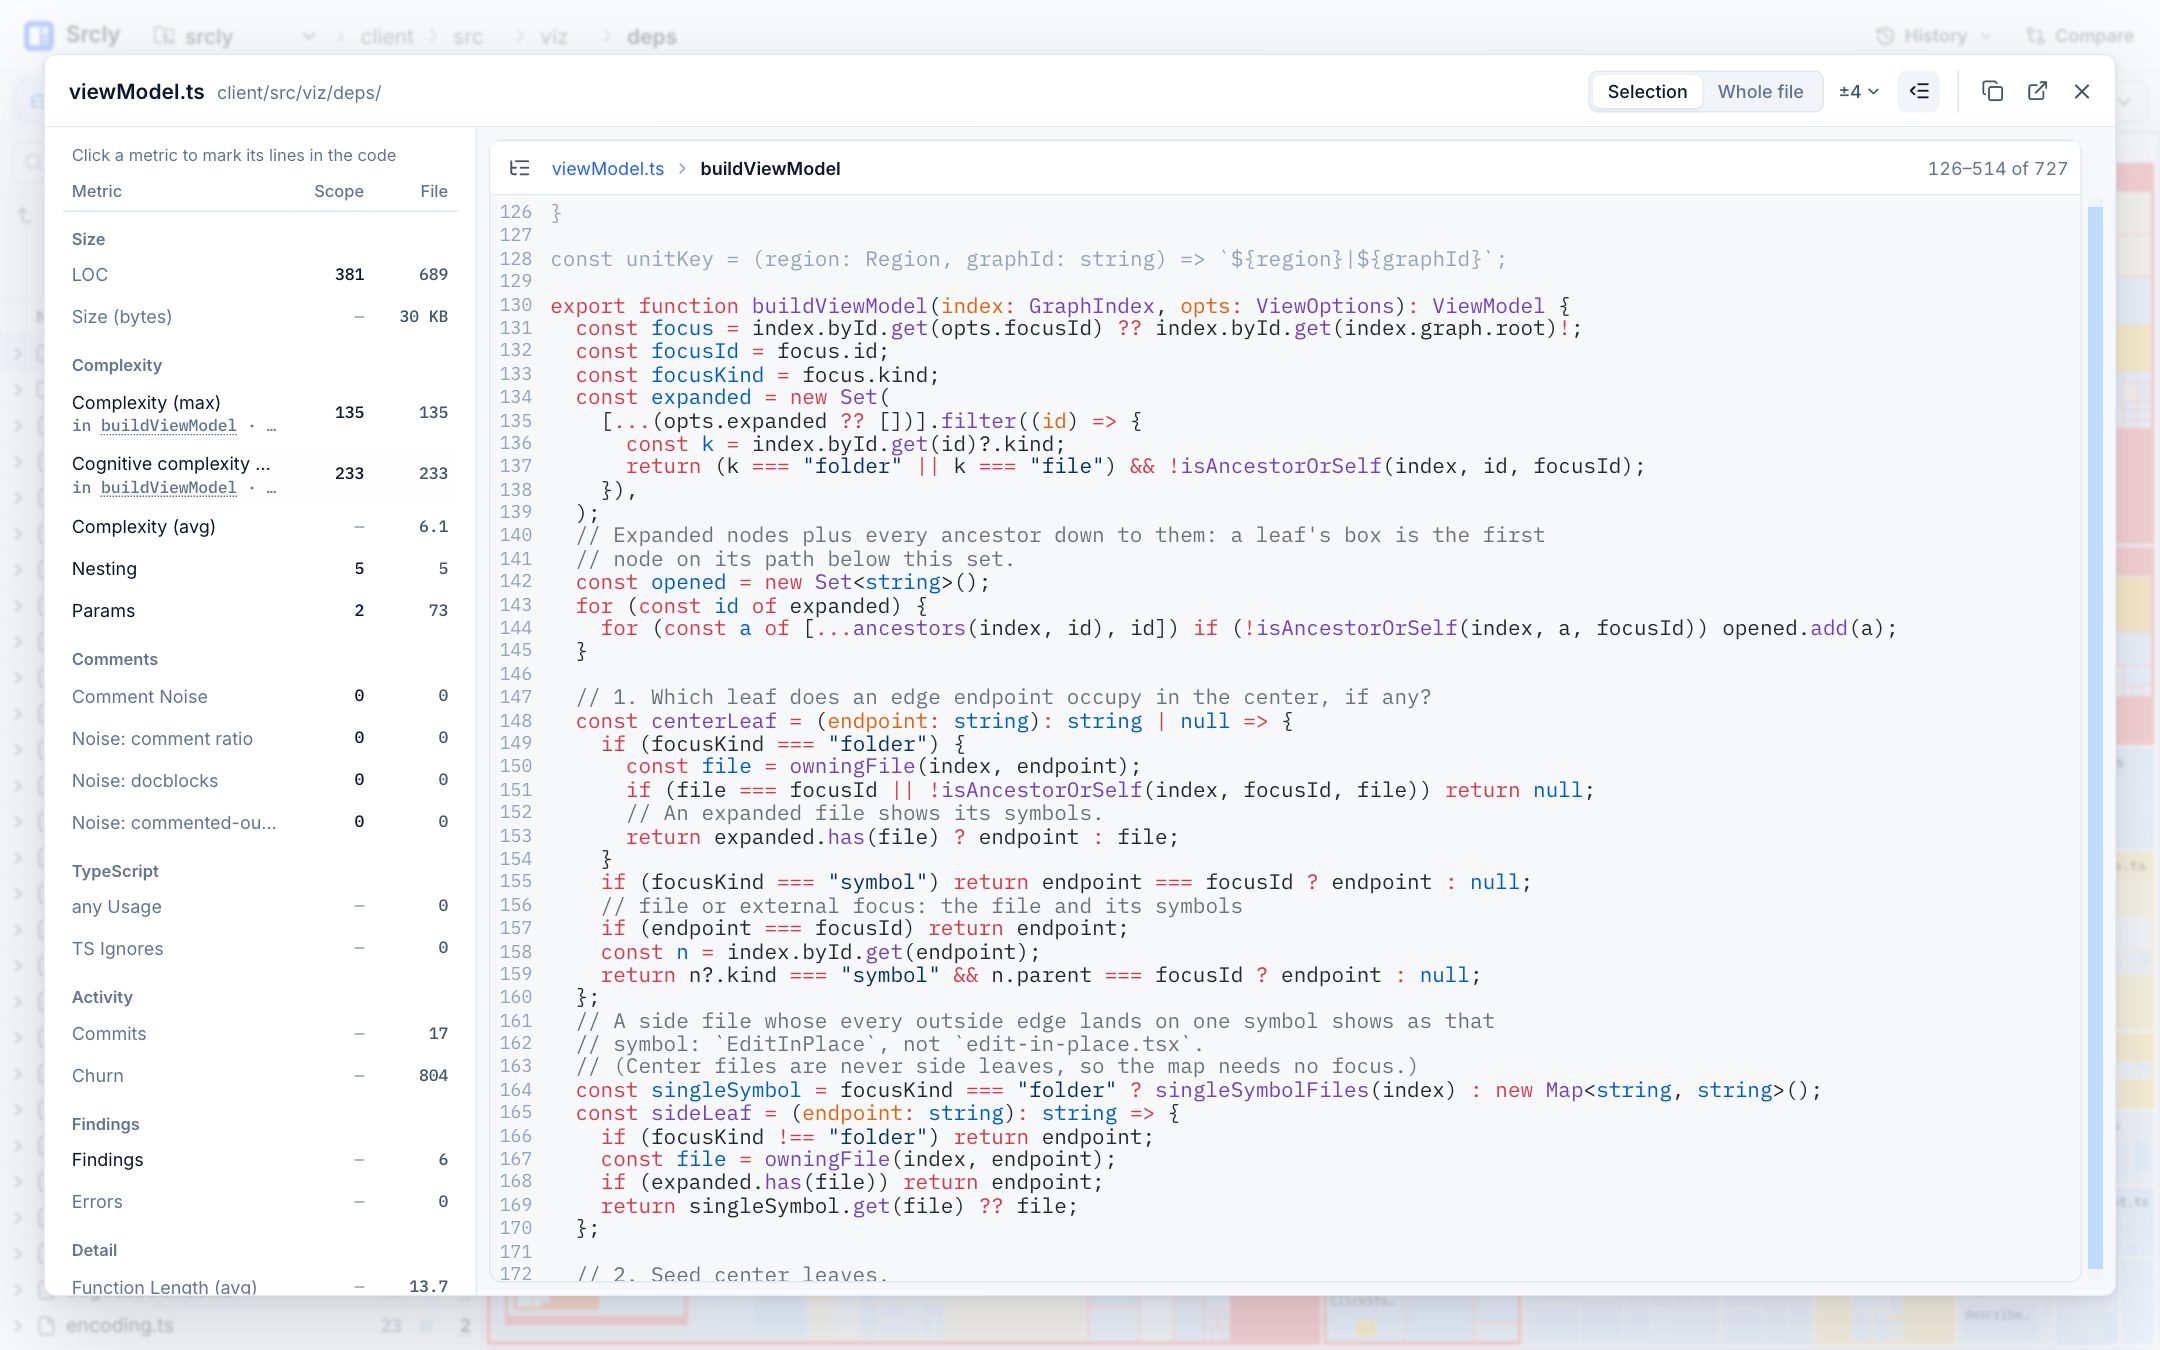
Opens the source with syntax highlighting, the file's metrics, and each finding with its rule and the tool that reported it. Click a metric to mark its lines in the code, such as each branch that adds to complexity. Markdown renders as a preview.
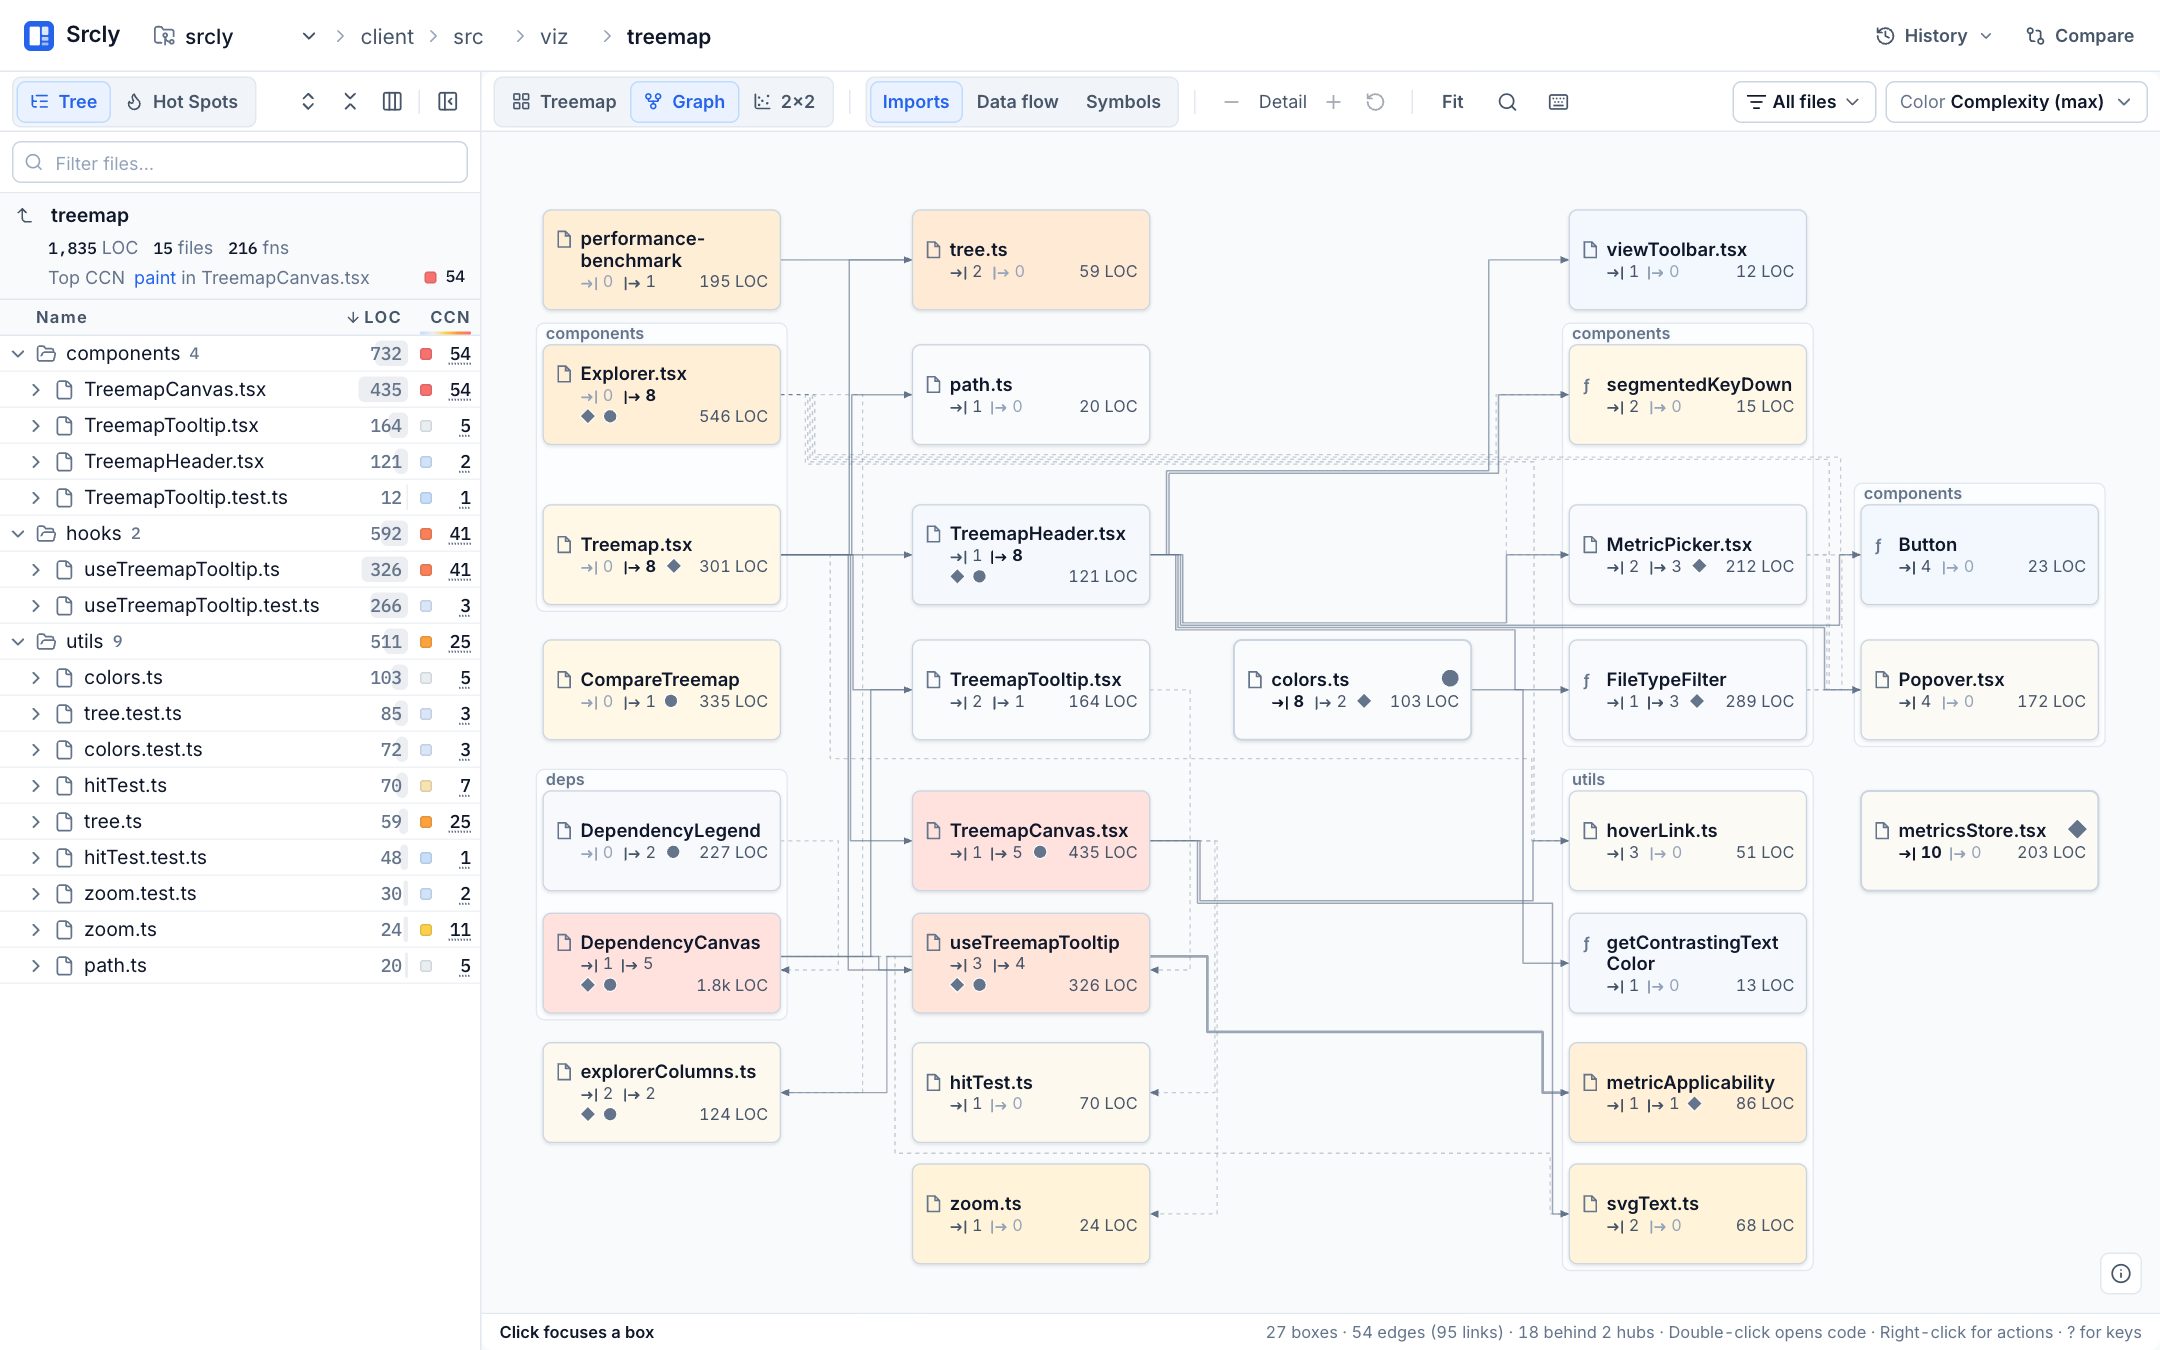
Shows TypeScript and Python imports as folders, files and symbols. The focus sits in the middle, what imports it on the left, and what it imports on the right. tsconfig path aliases resolve, and barrel files pass through to the real module.
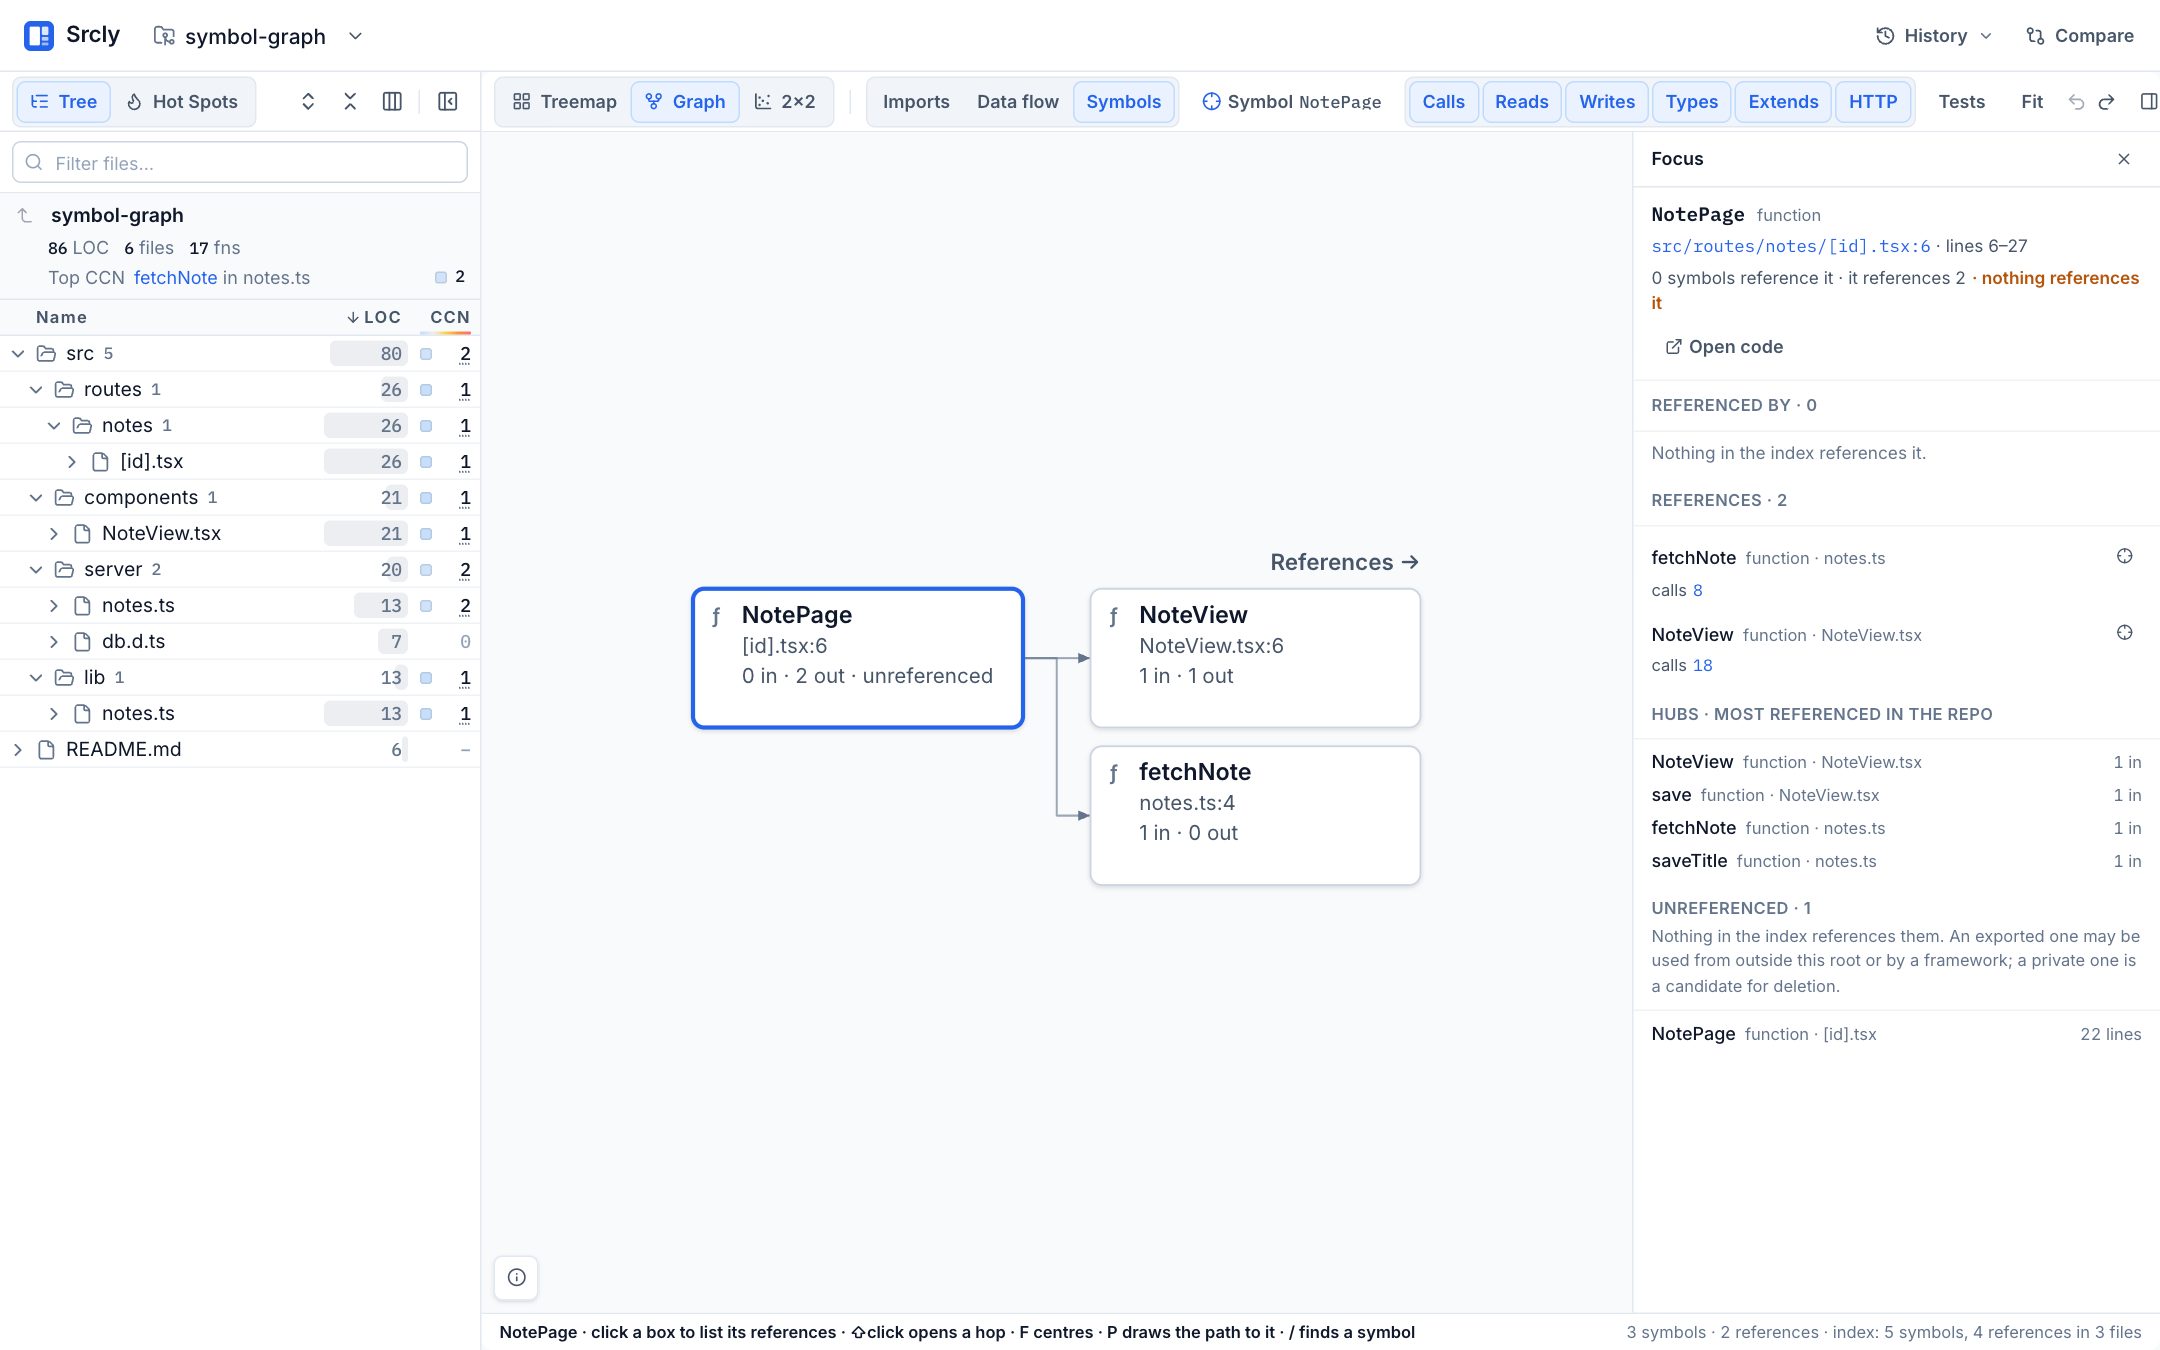
Centers one function, class or component and shows what refers to it and what it refers to, from a reference index for TypeScript and Python. Press / to find a symbol. It can draw the path between two symbols and mark dead code and hubs.
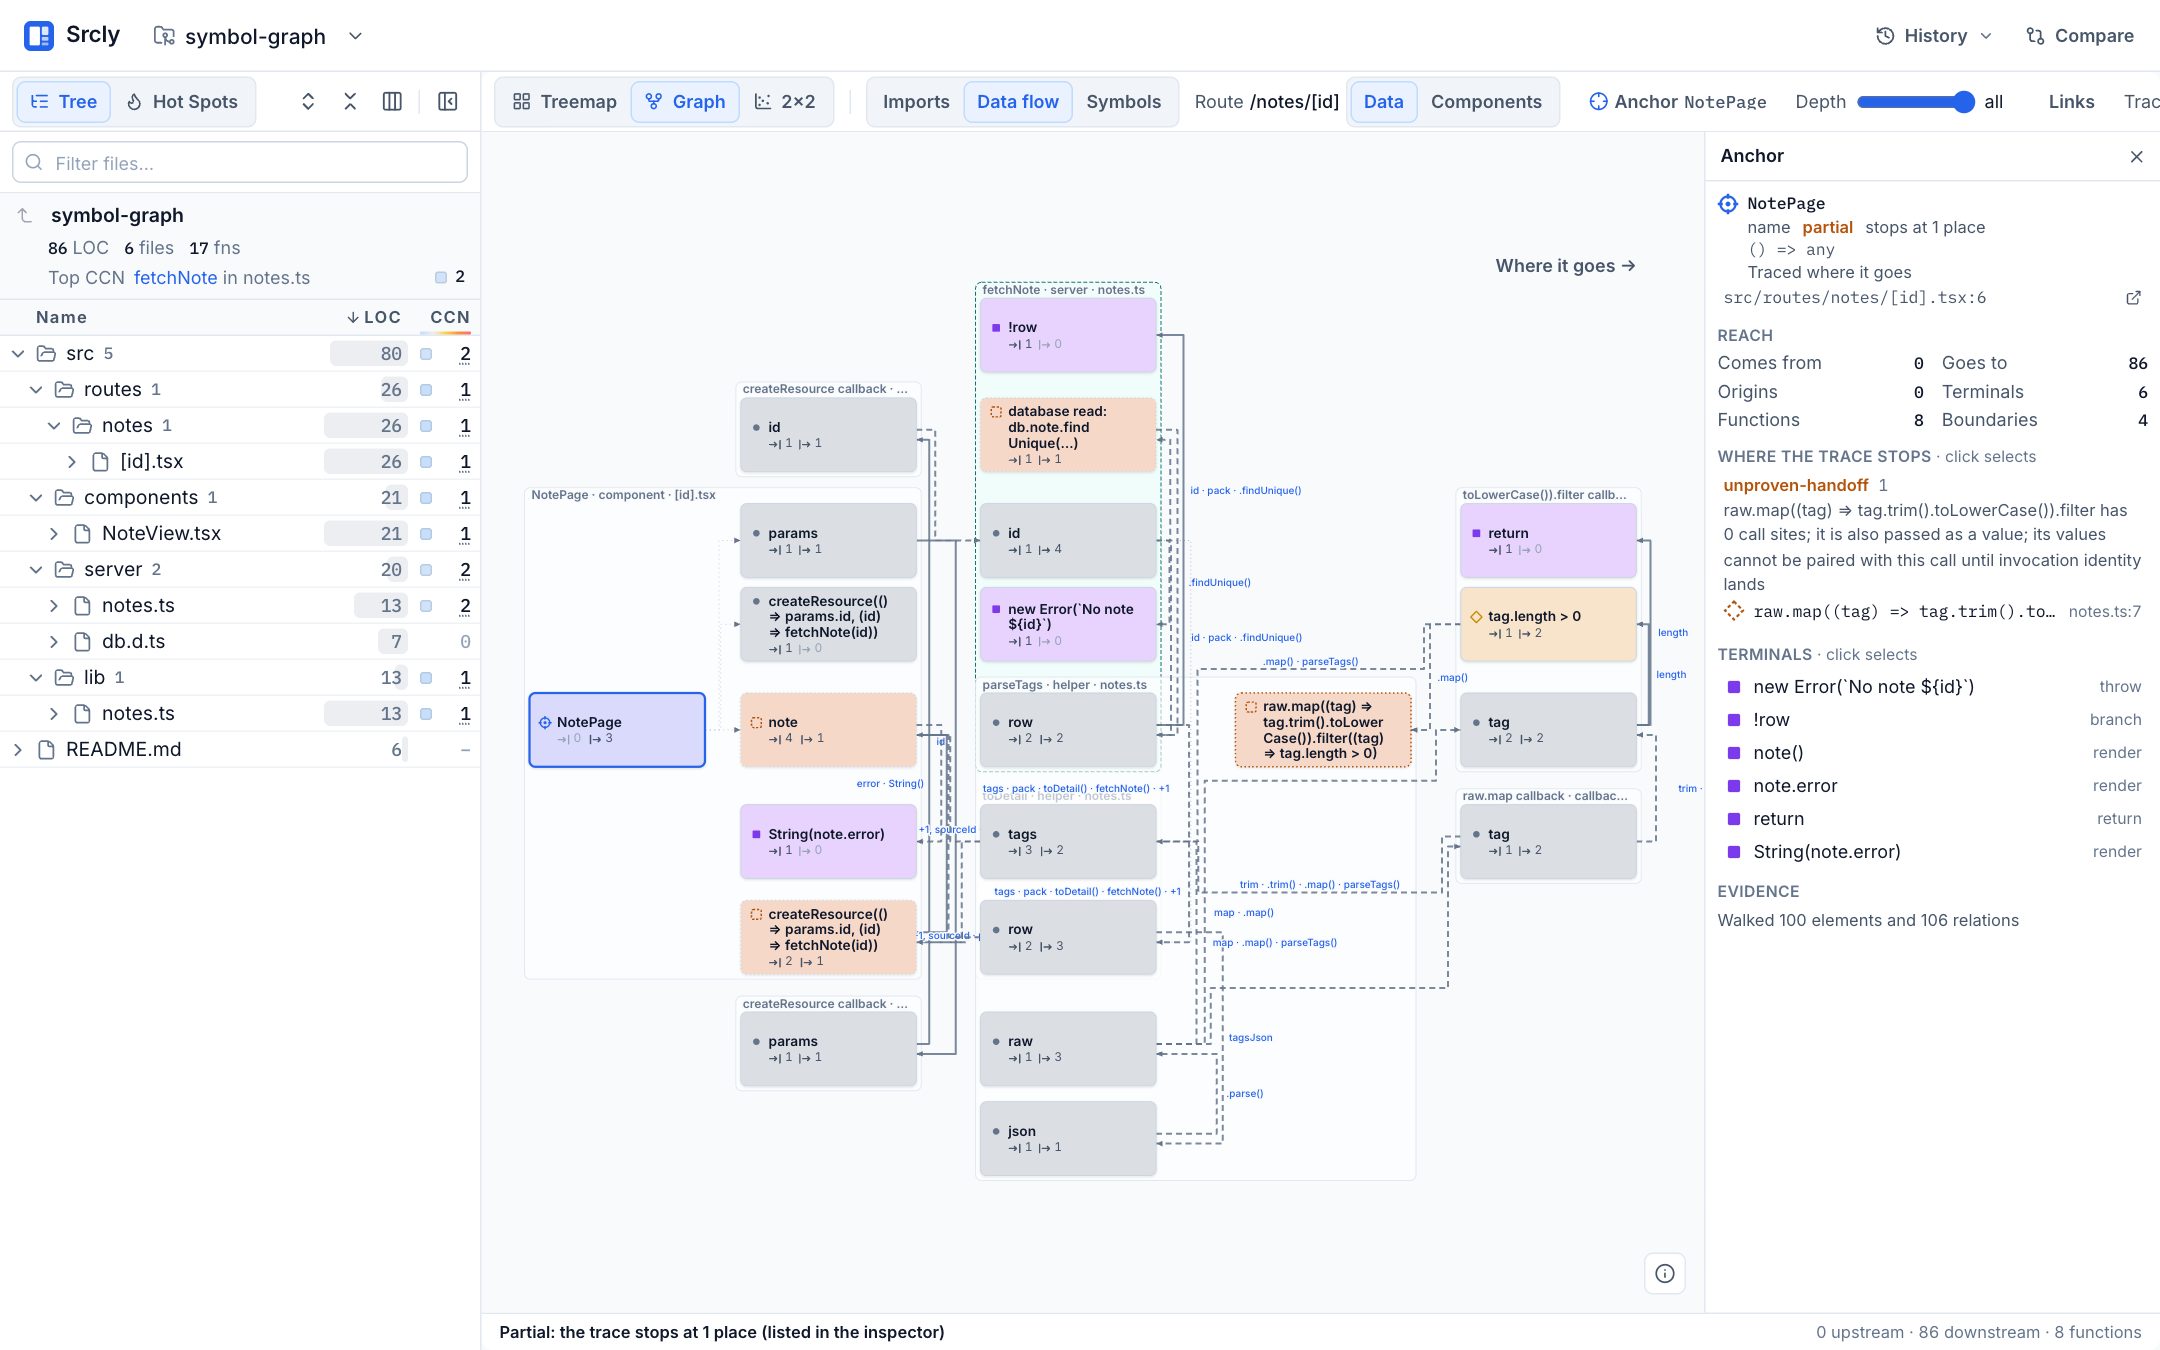
Traces how a value moves through calls in TypeScript, JavaScript and Python: from a route, a function or one expression, forward, backward or both. Each trace names its outcome and the places it stops. It needs Node.js 18 or newer.
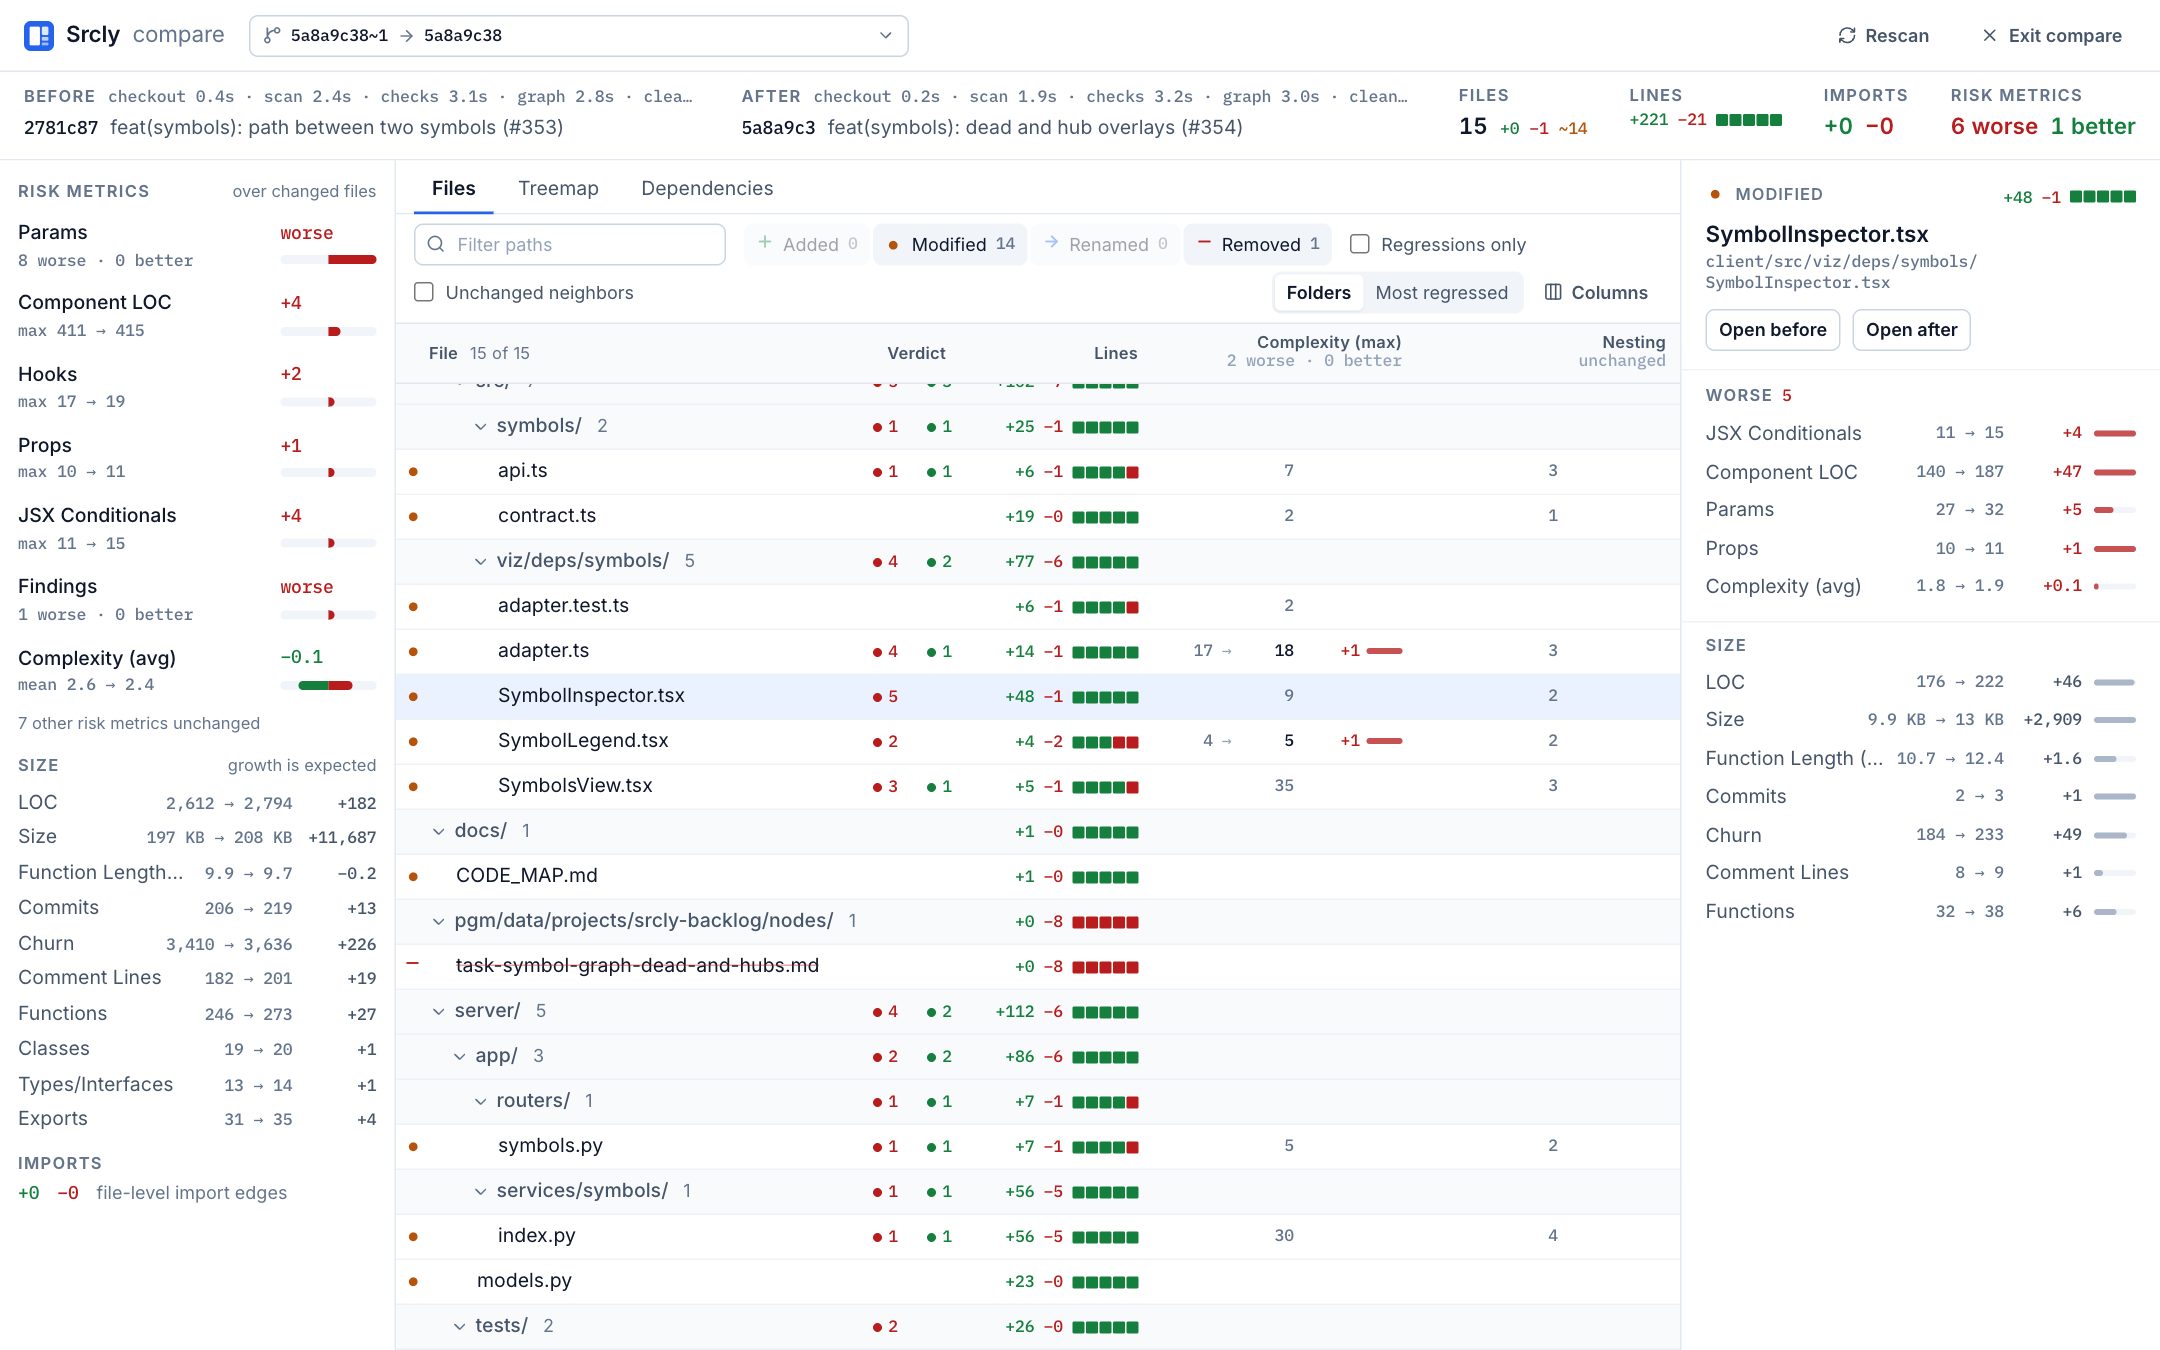
Shows what a change did to the codebase: which risk metrics got worse or better, and every changed file with its metric changes. The Treemap and Dependencies tabs show the before and after. Pick an open PR, a branch or a worktree, and step through a PR one commit at a time.
The symbols and data-flow shots use engine/examples/symbol-graph, a small app in the repository. A trace over the whole Srcly repository takes minutes.
Each starts with a question. The answer is a place to read code, not a verdict on it.
uvx srcly compare main pr:42.report writes size_budget.json: each code file over 5,000 tokens (bytes ÷ 4).uvx srcly check . --ratchet to a pre-commit hook or CI.uvx srcly fix . to print a diff of the safe fixes.--write to apply them.--rule unreachable-file. Reachability follows imports from the entries Srcly finds, plus any you add in srcly.toml.Headless commands run the same scan and share the app's cache. Machine-readable output is the only thing on stdout; progress goes to stderr.
| Command | What it does |
|---|---|
srcly [path] | Scan and open the app. --host and --port pick the bind address. |
srcly report | Write report.md and JSON artifacts: findings, folders, hotspots, a tree summary, the metric schema and an agent guide. --quadrant adds a 2×2. |
srcly explain --at | Drill into the repo, a folder, a file, or file::symbol. Any printed "start at" value works. |
srcly hotspots | Rank files or functions by one metric. --format json for scripts. |
srcly compare [base] [head] | Metric and dependency changes between two refs. Defaults to the merge base against the working tree; pr:<n> names a PR. |
srcly fix | Print a diff of safe fixes for srcly's own findings; --write applies them. |
srcly check --ratchet | Exit 1 when a file over the size budget grows. |
srcly scan | Write the raw analysis tree as JSON. |
uvx srcly hotspots . --metric complexity --cohort function --limit 61. 135 CCN client/src/viz/deps/viewModel.ts::buildViewModel:130-510
2. 71 CCN engine/src/analysis/route-totality-field-transfer-verifier.ts::consumerPattern:458-545
3. 69 CCN client/src/compare/graphModel.ts::buildCompareGraph:109-293
4. 66 CCN client/src/viz/deps/layout.ts::placeAndRoute:637-1101
5. 66 CCN engine/src/analysis/route-totality-field-lineage-transition.ts::classifyRouteTotalityFieldTransition:116-269
6. 66 CCN server/app/services/typescript/typescript_analysis.py::(class) TreeSitterAnalyzer::_get_function_name:687-848uvx srcly explain . --at client/src/viz/treemap9 ranked files (code). Score: the profile's weighted mix of complexity, size, nesting and history, 1.0 = the repo's worst; 0.4+ is a finding. Pass any "start at" value to --at.
| Folder | Files | LOC | Findings | Worst | Its worst file: start at |
|---|---|---|---|---|---|
client/src/viz/treemap/hooks/ |
1 | 326 | 0 | 0.3259 | client/src/viz/treemap/hooks/useTreemapTooltip.ts:255 buildTooltipContent |
client/src/viz/treemap/components/ |
3 | 720 | 0 | 0.2565 | client/src/viz/treemap/components/TreemapCanvas.tsx:167 paint |
client/src/viz/treemap/utils/ |
5 | 276 | 0 | 0.1536 | client/src/viz/treemap/utils/tree.ts:6 addScopeBodyDummyNodes |
| Score | Start at | Why |
|---|---|---|
| 0.3259 | client/src/viz/treemap/hooks/useTreemapTooltip.ts:255 buildTooltipContent |
High complexity 41, 326 LOC, nesting depth 2 |
| 0.2565 | client/src/viz/treemap/components/TreemapCanvas.tsx:167 paint |
High complexity 54, 435 LOC, nesting depth 3 |
| 0.1536 | client/src/viz/treemap/utils/tree.ts:6 addScopeBodyDummyNodes |
High complexity 25, 59 LOC, nesting depth 3 |
| 0.1452 | client/src/viz/treemap/utils/hitTest.ts:28 buildTileHitIndex |
High complexity 7, 70 LOC, nesting depth 4 |
| 0.1037 | client/src/viz/treemap/utils/colors.ts:62 scaleValue |
High complexity 5, 103 LOC, nesting depth 1 |
| 0.097 | client/src/viz/treemap/utils/path.ts:10 dfs |
High complexity 5, 20 LOC, nesting depth 2 |
| 0.0687 | client/src/viz/treemap/components/TreemapTooltip.tsx:7 tailPath |
High complexity 5, 164 LOC, nesting depth 1 |
| 0.0605 | client/src/viz/treemap/components/TreemapHeader.tsx:47 TreemapHeader |
High complexity 2, 121 LOC |
| 0.0491 | client/src/viz/treemap/utils/zoom.ts:4 zoomTransforms |
High complexity 11, 24 LOC, nesting depth 1 |
Not ranked as code: test 6 (mostly test file name; top client/src/viz/treemap/hooks/useTreemapTooltip.test.ts). Add --include-class <class> to rank one.
Analysis: reused the scan from 2026-11-20 22:53 UTC (no file has changed since); Git history at e448545; lint/type checks: ruff (180 files), srcly TS rules (745 files), srcly reachability (758 files), srcly Solid rules (158 files), srcly await-in-loop (632 files); 11 of 571 code files have none (finding_count N/A).
Next: srcly explain /tmp/srcly --at client/src/viz/treemap/hooks
Both outputs are real, from Srcly scanning itself at e4485453. Every command and flag · What each report file holds
Srcly runs headless, so an agent can scan a repository, read a ranked report, and drill into one scope at a time without loading the whole tree.
uvx srcly report . --out .srclyWrites report.md, findings.json, hotspots.json, tree.summary.json, metrics.schema.json and agent-skill.md. The terminal prints the top findings and the next command to run.
uvx srcly explain . --at server/app
uvx srcly explain . --at "server/app/run.py::_main"
Each answer reuses the cached scan, takes about a second, and ends with a Next: command. Any printed "start at" value works as --at.
uvx srcly compare --json
uvx srcly check . --ratchet
compare diffs the merge base against the working tree. A metric that is unavailable stays null, never 0.
skills/srcly-code-quality/SKILL.md: the workflow above as a skill file. Copy it into your agent's skills folder.llms.txt indexes every guide as Markdown. llms-full.txt is all of it in one file, with the metric catalog.docs/cli/index.md.--format json, report --stdout, scan --out -, compare --json) is the only thing on stdout. Progress goes to stderr.These tables come from Srcly's metric catalog, the same list the app's Color menu reads.
Rollup is how a folder or file combines its children. Max, named also names the function or component that sets it. How to read a metric
| Metric | Rollup | Languages | What it measures |
|---|---|---|---|
| General Size, complexity and comment noise for any code file. | |||
| Complexity (max) | max, named | TS/JS, TSX/JSX, Python, other code | Cyclomatic complexity: exact for a function; for a file or folder, its most complex function, which it names. |
| Cognitive complexity (max) | max, named | TS/JS, TSX/JSX, Python | How hard a function is to follow (Sonar's cognitive complexity): each if, loop, catch or ternary costs 1 plus its nesting, and each run of && or || costs 1, so a flat chain of checks stays low. A file or folder holds its worst function, which it names. |
| Complexity (avg) | average | TS/JS, TSX/JSX, Python, other code | Mean cyclomatic complexity per function; folders weight by function count. |
| LOC | sum | any file | Lines of code, excluding comments and blanks where the analyzer can tell. |
| Size | sum | any file | File size in bytes. |
| Comment Noise | sum | TS/JS, TSX/JSX, Python | Over-commenting flags: functions with more comment lines than code lines (10+ code lines), docblocks over 1.5x their body (8+ lines), and 3+ line runs of commented-out code. |
| Nesting | max | TS/JS, TSX/JSX, Python | Deepest control-flow nesting. |
| Params | sum | TS/JS, TSX/JSX, Python, other code | Function parameters; a file sums its functions, so rank the Functions cohort for arity. |
| Components React/Solid components in TSX: a file holds the max over its components and names it. | |||
| Component LOC | max, named | TSX/JSX | Lines in one React/Solid component. A file or folder holds the max over its components and names it. |
| Hooks | max, named | TSX/JSX | Hooks (use*) and Solid primitives (create*) in one component. A file or folder holds the max over its components and names it. |
| Effects | max, named | TSX/JSX | useEffect/useLayoutEffect/createEffect calls in one component. A file or folder holds the max over its components and names it. |
| JSX Depth | max, named | TSX/JSX | Deepest JSX nesting inside one component. A file or folder holds the max over its components and names it. |
| Props | max, named | TSX/JSX | Declared props of one component (props type members or destructured names). A file or folder holds the max over its components and names it. |
| Inline Handlers | max, named | TSX/JSX | Inline on*={() => ...} handlers in one component. A file or folder holds the max over its components and names it. |
| JSX Conditionals | max, named | TSX/JSX | JSX conditionals (?:, &&, <Show>, <Match>) in one component. A file or folder holds the max over its components and names it. |
| TypeScript Type-safety escapes in .ts and .tsx files. | |||
| any Usage | sum | TS, TSX | Explicit any types. |
| TS Ignores | sum | TS, TSX | @ts-ignore / @ts-expect-error / @ts-nocheck directives. |
| Markdown Markdown documents. | |||
| Markdown Data URLs | sum | Markdown | Inline data: URLs (embedded images) in Markdown. |
| Activity Git history per file in the selected window (90 days by default). On whenever the folder is a Git repo. | |||
| Commits | sum | any file | Non-merge commits that touched the file in the activity window, following renames. Frequent change in complex code is where refactoring pays off. |
| Churn | sum | any file | Lines added plus removed by those commits. Kept apart from commit count: one bulk rewrite churns a lot in a single commit. |
| Findings Lint and type-check results: the project's own tsc and eslint when it has them, otherwise srcly's bundled ruff and TS rules. No setup. | |||
| Findings | sum | TS/JS, TSX/JSX, Python | Everything the checkers reported for the file: the project's tsc and eslint, or srcly's ruff and TS rules. The code viewer lists each one with its rule and tool. |
| Errors | sum | TS/JS, TSX/JSX, Python | Findings the checker calls errors: type errors, eslint errors, syntax errors and undefined names. Warnings aren't counted. |
| Data flow Render-path evidence from the TypeScript checker, after `srcly report --dataflow`: dead `??` guards, repeated forks and the worst value path in each TS/TSX file. | |||
| Impossible Defenses | sum | TS, TSX | ?? and ?. whose guarded value the TypeScript types say is never null or undefined, so the fallback never runs. Only a type checker can prove this. |
| Repeated Forks | sum | TS, TSX | Components that test the same discriminant at several sibling branch sites (ternaries, &&, Solid <Show> and <Match>): each wants one sub-component per branch. |
| Prop Relay | max | TS, TSX | The most component boundaries a value crosses on its way to one of the file's render sinks. |
| Shape Changes | max | TS, TSX | The most representation-only steps (alias, object pack, spread) on one of the file's render paths. |
| Path Depth | max | TS, TSX | The most steps from a source (prop, signal, local) to one of the file's JSX sinks. |
| Value Fan-Out | max | TS, TSX | The most render sinks that one of the file's sink sources also feeds. Wide reach is a fact, not a fault. |
| Detail Counts that describe code without saying it needs work: shown and colorable, never ranked. | |||
| Function Length (avg) | average | TS/JS, TSX/JSX, Python, other code | Mean function length in LOC; folders weight by function count. Detail: the M7 pilot's queues were tests, markup and one-function files. |
| TODOs | sum | TS/JS, TSX/JSX, Python | TODO/FIXME-style comments. |
| Narrated Code | sum | TS/JS, TSX/JSX, Python | Comment noise part: functions (or a whole file) with more comment lines than code lines and 10+ code lines. |
| Oversized Docblocks | sum | TS/JS, TSX/JSX, Python | Comment noise part: docblocks or docstrings of 8+ lines that are over 1.5x their function's code lines. |
| Commented-out Code | sum | TS/JS, TSX/JSX, Python | Comment noise part: runs of 3+ line comments that parse as code. |
| Comment Lines | sum | TS/JS, TSX/JSX, Python | Comment lines. |
| Functions | sum | TS/JS, TSX/JSX, Python, other code | Executable functions at any depth (methods, nested functions, arrows). |
| Classes | sum | TS/JS, TSX/JSX, Python | Class declarations. |
| TS Imports | sum | TS, TSX | Distinct import sources. |
| Types/Interfaces | sum | TS, TSX | Type and interface declarations. |
| Exports | sum | TS, TSX | Export declarations. |
| Python Imports | sum | Python | Import statements. |
| Files | sum | any file | Files a node represents. |
Srcly picks an analyzer by file extension. Each file runs in a worker process with a hard timeout, so one bad file can't stop the scan. Git-ignored files and folders such as node_modules and dist are skipped.
| Files | Analyzer | What it adds |
|---|---|---|
| TypeScript, TSX, JavaScript, JSX | tree-sitter (JS parses with the TSX grammar) | Functions and nested scopes, complexity, cognitive complexity, nesting, comment noise, React and Solid components, TS escapes |
| Python | tree-sitter | Functions, classes and nested scopes, complexity, cognitive complexity, nesting, comment noise |
| CSS, SCSS | tree-sitter | Each rule and at-rule block as a scope |
| Markdown | tree-sitter | Heading sections, code blocks and block quotes as scopes, data URL count |
| Jupyter notebooks | Srcly's notebook reader | Each cell as a scope; LOC counts cell source, never outputs |
| Go, Java, C, C++, C#, PHP and the rest Lizard reads | Lizard | Functions, complexity, parameters |
| YAML, shell, HTML and other text | line count only | LOC and size; other metrics are N/A |
Checkers run in the background beside the scan, with no setup. A checker that is missing, fails or times out leaves its files N/A with the reason. Findings guide
tsc | The project's own tsc --noEmit for each tsconfig, when node_modules/.bin has it |
eslint | The project's eslint and its config, when it has both |
ruff | Bundled with Srcly. Uses the project's ruff config, or bug-finding rules (E9, E722, F, B, PLE) labelled "srcly defaults" |
srcly TS rules | TS files no project tool covers: explicit any, @ts-ignore without a reason, @ts-nocheck, chains of non-null assertions |
srcly reachability | Unreachable files and unused exports, walking imports from detected entries |
srcly Solid rules, await-in-loop | Solid cleanups returned from onMount or createEffect, and await inside a loop |
ast-grep | Your own YAML rules in .srcly/rules/ |
Most projects need none. Two files at the Git root change what Srcly checks. Configuration guide
# srcly.toml: extra entry points for reachability
[reachability]
entries = ["app/scripts/**/*.ts"]

# .srcly/rules/*.yml: ast-grep rules reported beside tsc, eslint and ruff
SRCLY_CACHE_DIR | Where scans are saved. Default: ~/Library/Caches/srcly on macOS, ~/.cache/srcly on Linux, %LOCALAPPDATA%\srcly\Cache on Windows |
SRCLY_NODE | The Node.js 18+ binary for data flow. Default: node on PATH |
SRCLY_FINDINGS_TIMEOUT | Seconds each checker may run (default 120 for tsc and eslint, 60 for the rest) |
SRCLY_DATAFLOW_TIMEOUT | Overrides every data-flow request timeout |
SRCLY_AST_GREP | The ast-grep binary, ahead of the project's and PATH |
I started Srcly in 2025 because I wanted to look at a codebase as a whole: where the code is, how complex it is, how often it changes, and how the pieces connect. A file list can't show that. A map can.
It is a FastAPI server and a SolidJS client. The scan runs Lizard for broad language coverage, and tree-sitter analyzers where I want more than a function count. Everything lands in one tree of folders, files, functions and scopes, and the metrics roll up that tree so any level can be sorted, colored and ranked. The data-flow engine is TypeScript, so it runs as a Node process that starts only when you open that view.
A few things I learned on the way:
else if chains.The longer story is on the Srcly project page , with posts on the dependency graph, the metric overlay and compare.