Use Srcly's linked views to move from a broad signal to the source behind it. This guide helps you choose a view, inspect its evidence, and decide whether the result needs follow-up.
Choose the view for your question
| Question | View | What to inspect next |
|---|---|---|
| Where is code concentrated? | Treemap | Open the largest folder or file, then inspect its children. |
| Which files or functions rank highest for one signal? | Hot Spots | Check the metric, cohort, value, and witness. |
| Which items have two signals at once? | 2×2 | Read the axis names and cut-offs; select points to inspect members. |
| What imports this TypeScript or TSX module? | Dependency graph | Follow direct import relationships and their source locations. |
| How does a modeled value move through supported code? | Data flow | Read the outcome, assumptions, and stop points. |
These views are not interchangeable. The dependency graph describes imports; it does not establish runtime calls or value movement. Data flow traces selected modeled relations and has different language coverage. See Data-flow analysis before interpreting a trace.
Symbols mode
Switch the graph from Imports to Symbols to inspect references around one symbol. The focus appears in the middle; referrers appear on the left and referenced symbols on the right, grouped by their source files and classes. Press / to search symbols. Select a box to read its reference lines in the inspector. Shift-click a box or press E to open its own hop in place. Use the kind chips and Tests control to narrow the graph. The edge's resolution label matters: exact, typed, and name-based matches are different levels of evidence. Follow an edge into source before relying on it.
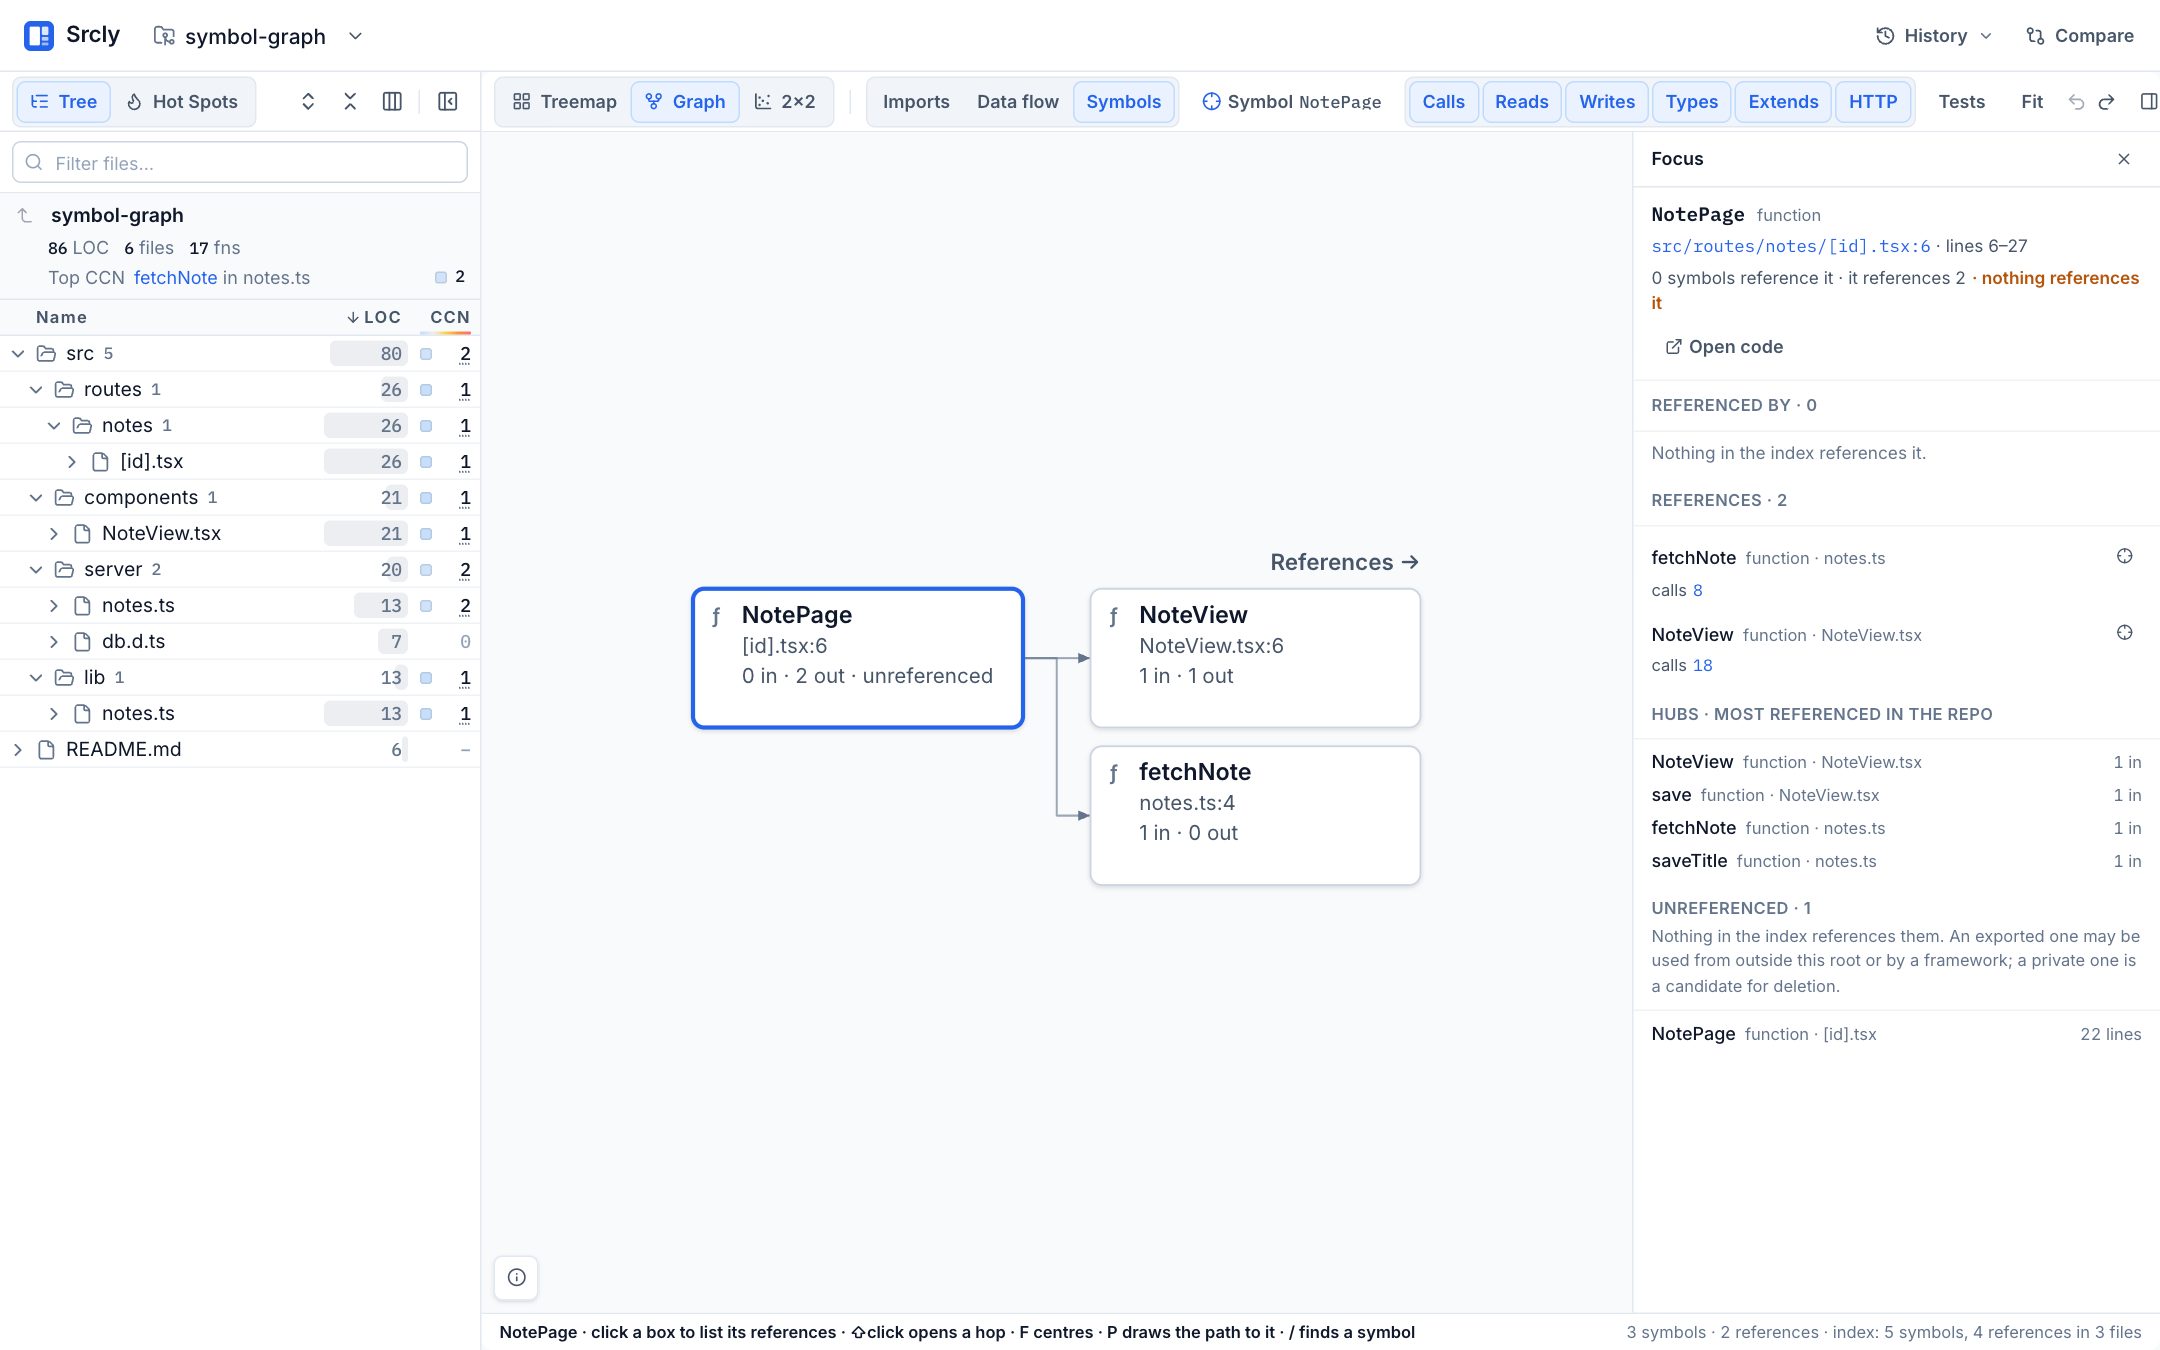
NotePage and shows its references to fetchNote and NoteView. The inspector provides source locations and reference counts.Read the treemap
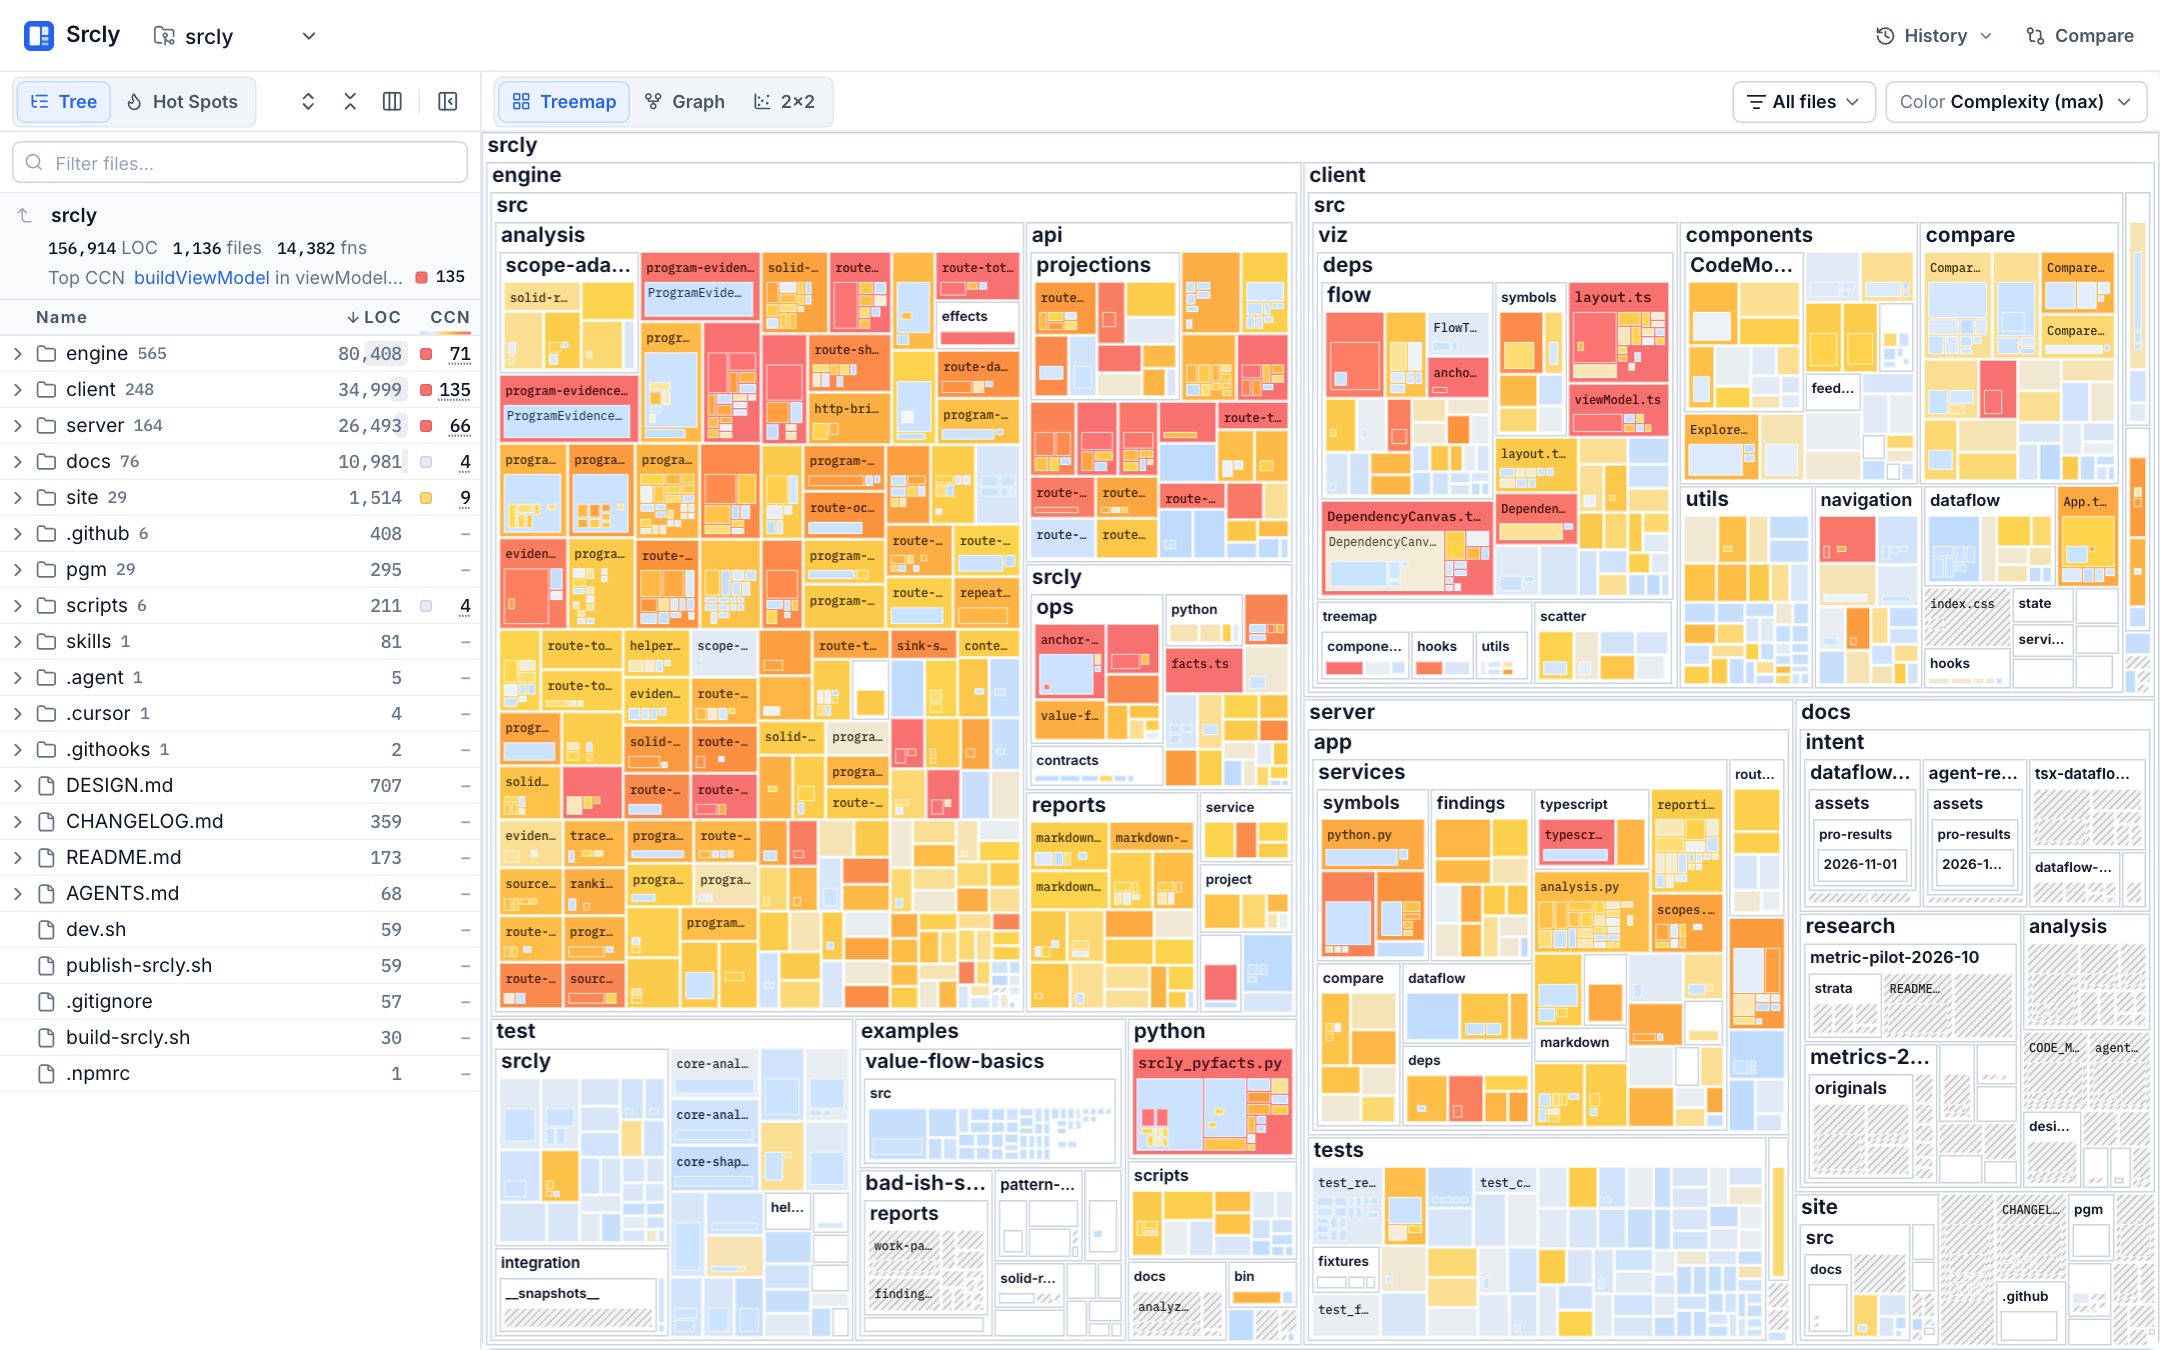
Each rectangle represents a folder, file, function, or code fragment. Area represents lines of code (LOC). Choose a metric to color tiles and read its legend. Open a folder or file to focus the map. Use the path and file-type controls to narrow the visible scope. Hiding a path changes the view; it does not alter source files or the scan.
A large tile is not automatically a problem. It may reflect a legitimate module or generated content that should be excluded. Use the tile to choose where to inspect, then confirm its classification and contents in the explorer or code viewer.
Rank candidates with Hot Spots
Hot Spots ranks files or functions for one selected metric and cohort. Select a metric, then choose whether to rank files or functions where the control is available. The list orders measured values worst first and presents a witness when the value is an aggregate. N/A results are grouped separately because they cannot be ranked as measured values.
Open a row to focus the corresponding source. Check the metric definition and cohort before comparing two entries. A file rank compares files; a function rank compares functions. A high value means “inspect this,” not “change this.” The Metrics guide explains aggregation and availability.
Compare two signals in the 2×2 view
The 2×2 view places files, functions, or supported components on two metric axes. Presets include activity, blast radius, component weight, comment noise, and findings. Choose the preset and cohort, then read the axis labels. Drag the cut-offs to explore how different thresholds change quadrant membership. Select a group or point to inspect its members.
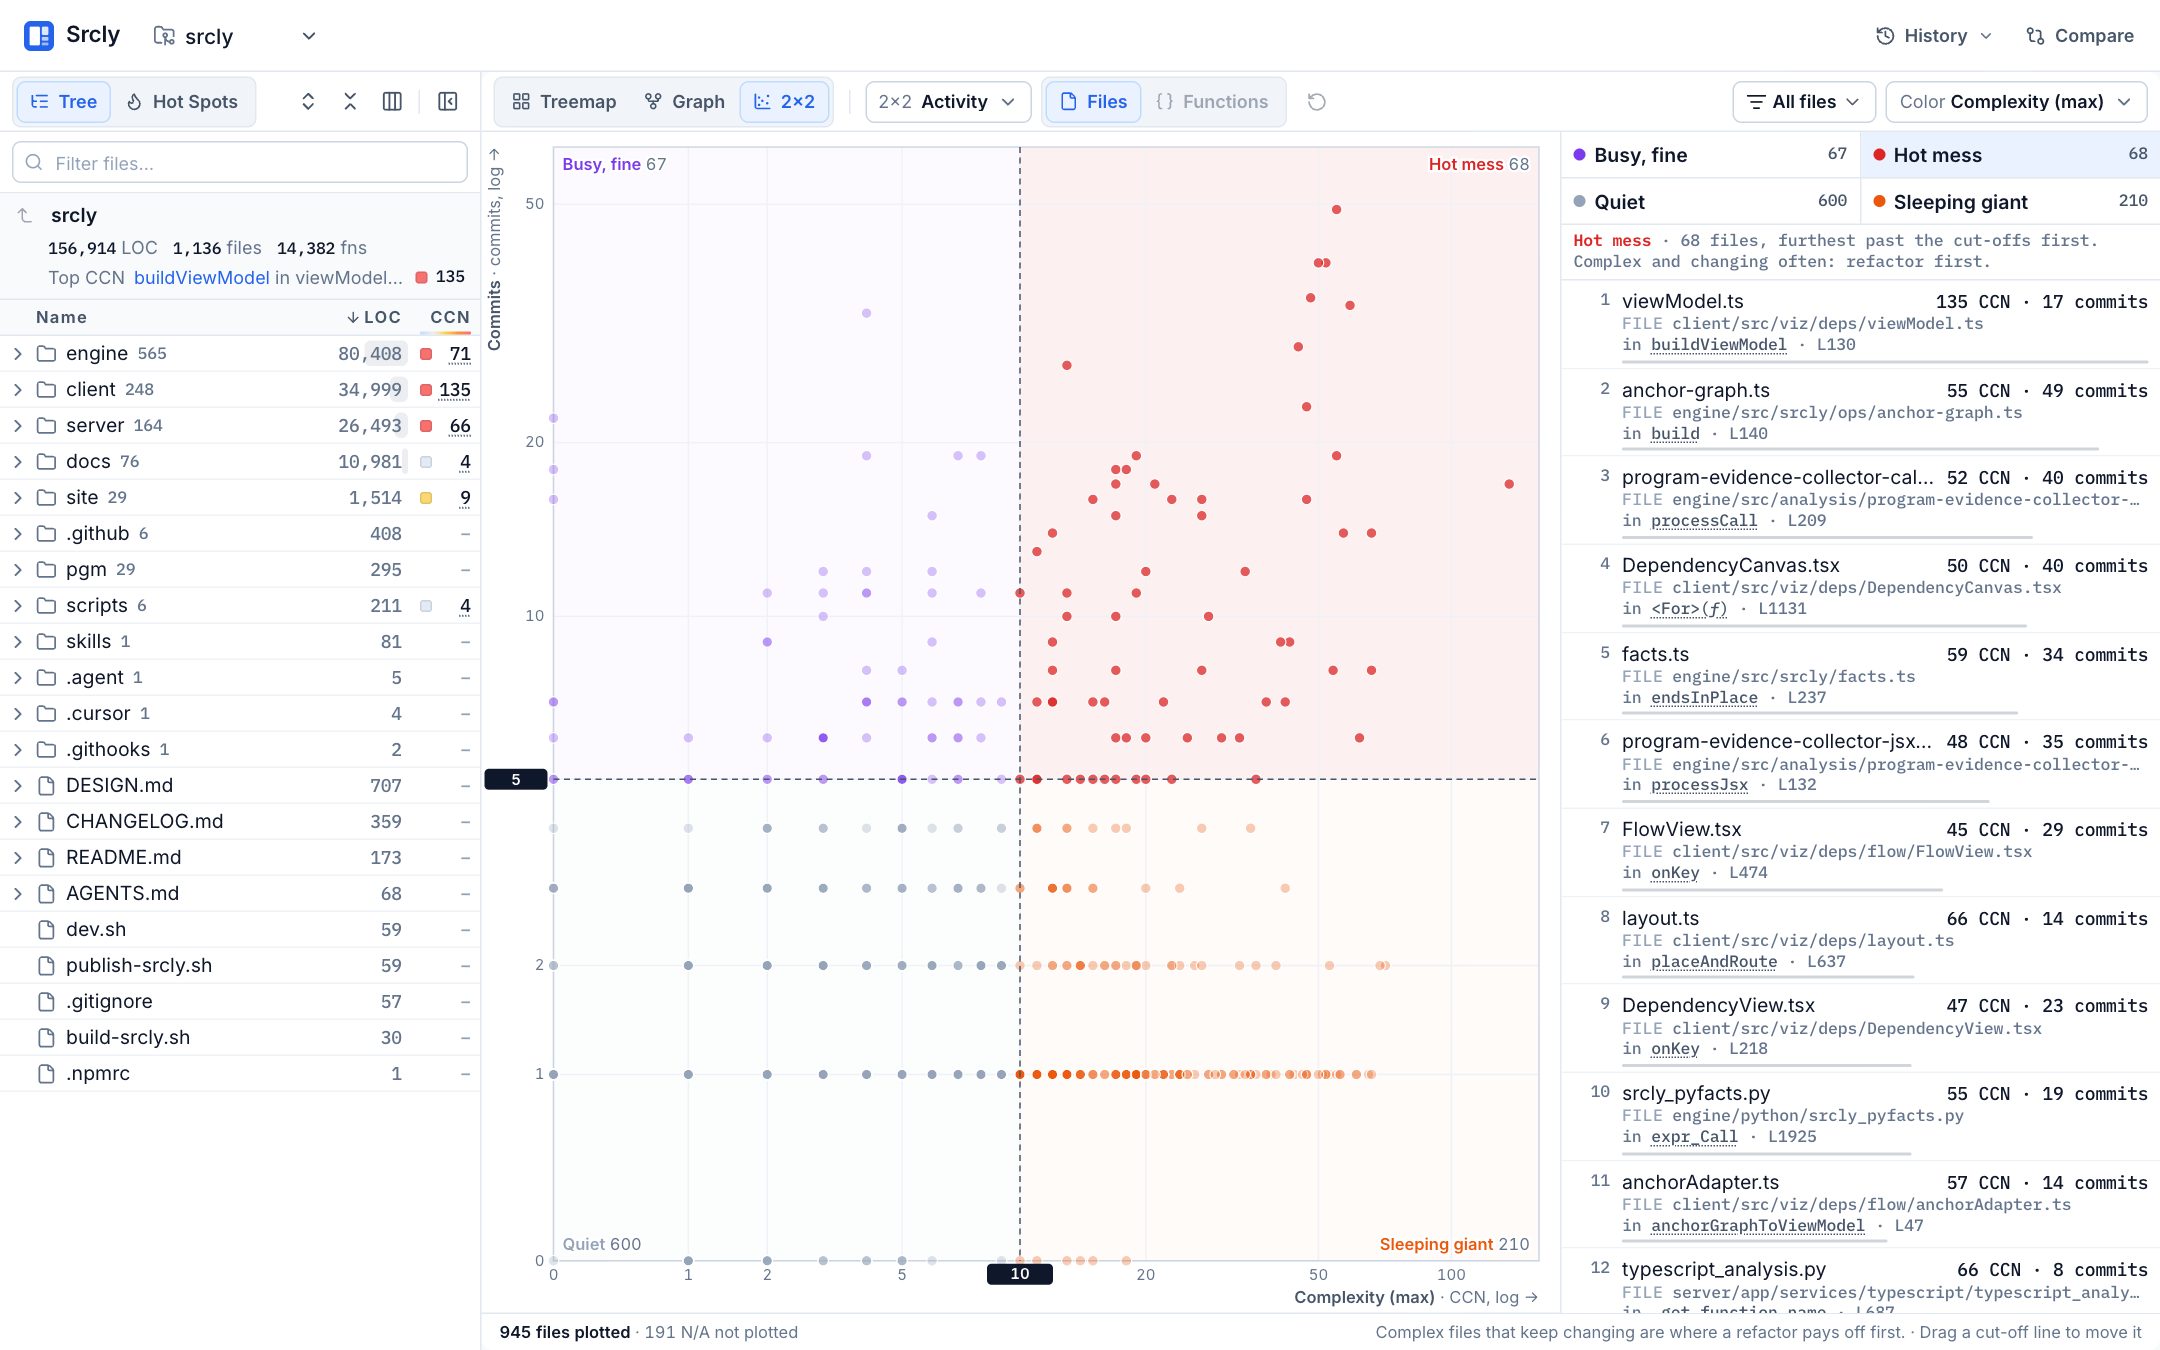
The cut-offs help you ask a question; they are not universal risk boundaries. A preset can omit unavailable points or show that it has no usable data. Read the selected metrics, cohort, and cut-offs before comparing groups. A point's position is not an overall quality grade.
Inspect source and relationships
Select a file or function from a tile or row to open the code viewer. Review the source, metric values, checker findings, and line evidence together. For a folder maximum, follow its witness function. For a checker finding, note the rule and tool that produced it. Some file classes, such as tests, docs, fixtures, generated, or vendored files, may be counted but left out of a default findings rank; see Findings.
Use the dependency graph to understand direct TypeScript and TSX imports, including nearby path aliases and external packages when available. Use Data flow for modeled routes, values, or function effects. A missing edge is not proof that no relationship exists. The dependency graph may not cover other languages; data flow can stop at unsupported constructs. See Configuration for setup limits.
A practical review sequence
- State the question before choosing a metric.
- Choose the matching view and check its legend, cohort, or axes.
- Select a high or unexpected item and open its source.
- Read the metric definition, witness, checker identity, and coverage status.
- Confirm a suspected issue with source, tests, or the project's checker.
- Record the decision and any evidence gap.
This sequence avoids treating size, complexity, or a static-analysis message as proof of a bug. If you need a saved investigation, use uvx srcly report . --out .srcly, then narrow it with uvx srcly explain . --at path/to/file. The Reports guide maps artifacts to questions.