Data flow traces how values move through supported source code. Use it to investigate where a request is handled, what a function does with an input, or where a value is written or returned. It is separate from the TypeScript and TSX import dependency graph.
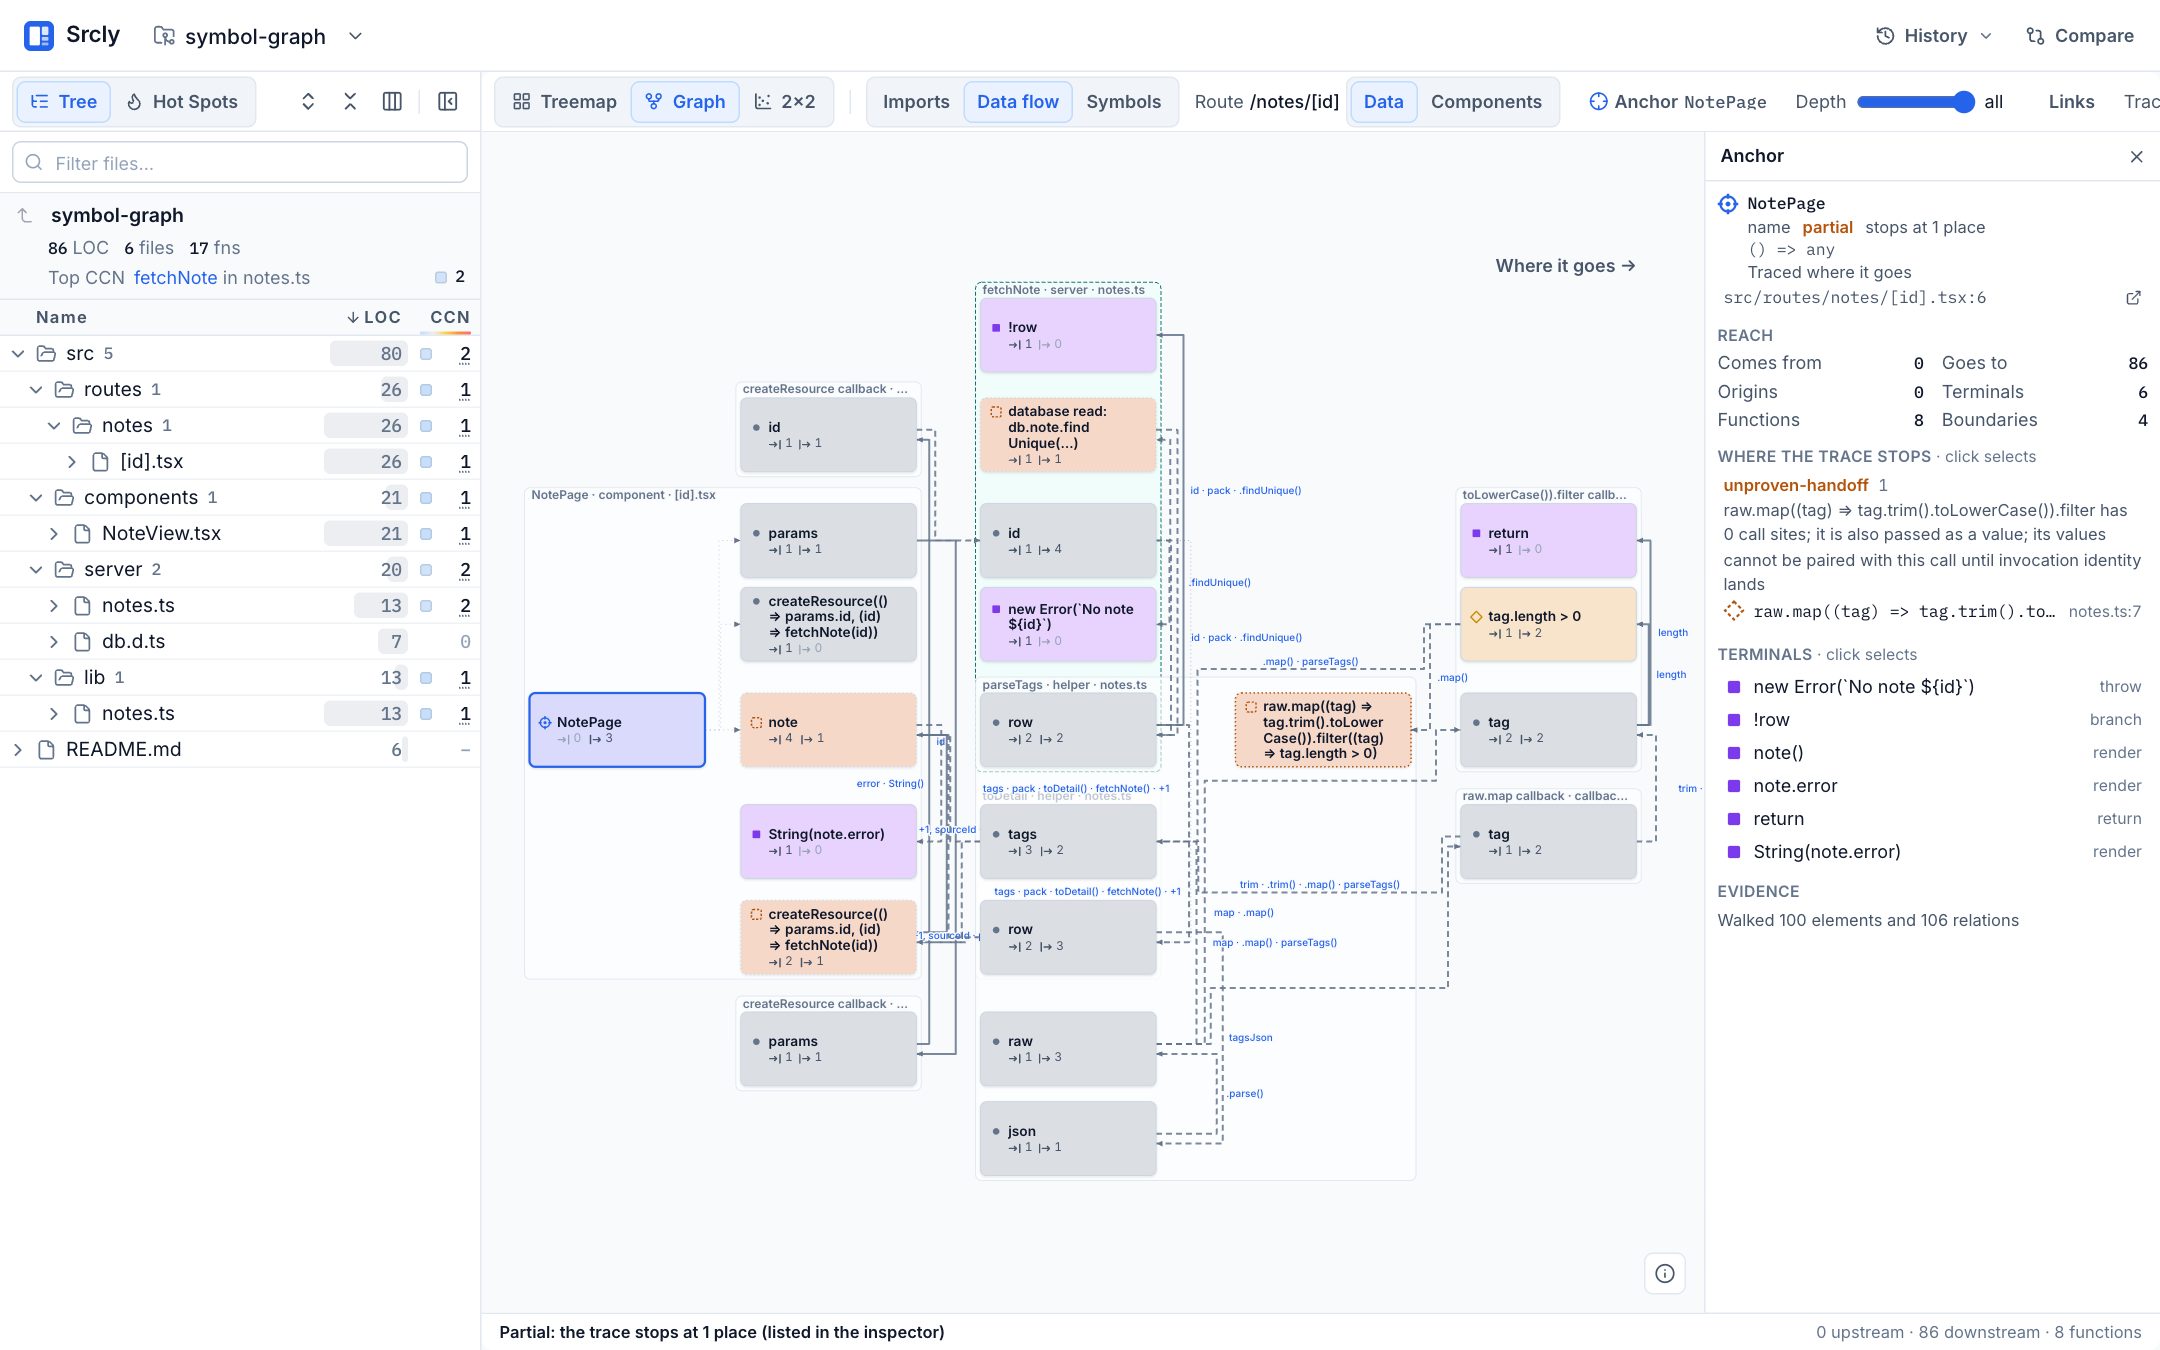
/notes/[id] route trace in the included symbol-graph example is anchored at NotePage. It is partial: one callback handoff has no call sites to pair its values. Inspect the unproven handoff before relying on the path.Open a trace
- Analyze a supported repository in the app.
- Select a file or function and switch to Data flow.
- Choose an available anchor, such as a route, exported function, or file.
- Select a graph item to inspect its source location and modeled relations.
- Read the outcome and any assumptions, stops, or unavailable reason.
Depending on the anchor and language, Srcly can show a route, value-flow trace, or function effects. A route graph may show where a route's values move; an anchor graph starts from a selected symbol. The exact view depends on available code facts and supported language constructs.
Data-flow reports and findings
For a repository summary or an agent workflow, add --dataflow to a report:
uvx srcly report . --out .srcly --dataflow
The engine traces every render path in the TypeScript and TSX program, from a prop, signal, or local to the JSX that renders it. This takes minutes on a large app, so it runs only when you ask. It adds:
dataflow.md: ranked work packets with candidate edits, the risk queue and a stop recommendation, then the defensive ledger, repeated forks, prop relay, context relay, and fan-out.- Four finding rules in the Data flow section of
report.md.impossible-defenseis a??or?.whose guarded value the types say is never null or undefined.repeated-forkis a component that tests the same discriminant at several sibling branch sites, including Solid<Show>and<Match>.context-relayandbroad-prop-bundleare a parent that reads a context hook and passes context-like props, or three or more plain props, to a child in the same feature. - Six metrics per TS/TSX file in the Data flow group: impossible defenses, repeated forks, prop relay, shape changes, path depth, and value fan-out. After the run, the app colors the treemap and marks the code viewer with them while the files stay unchanged.
uvx srcly compare --dataflow runs the engine on both sides and diffs these metrics.
Requirements and language support
The bundled engine requires Node.js 18 or newer on PATH. Set SRCLY_NODE to choose another executable. The engine analyzes TypeScript, JavaScript, and Python roots. TypeScript and JavaScript projects are detected from project configuration or source files; loose files can also be analyzed. Python projects are detected from Python project files or .py files.
Python analysis has a different feature set from TypeScript. Python routes can open their handler in anchor mode; the TypeScript route graph does not apply to Python. Without project type configuration, some guarantees about null values are unavailable. Unsupported constructs and incomplete evidence can stop a trace early.
If Node or the engine is unavailable, Srcly names the reason and leaves the rest of the scan available. An unavailable trace is not an empty proof. See Configuration for selecting Node and Get started for the base scan.
Read outcomes honestly
Trace outcomes distinguish different evidence states. The app may show no status text for a landed, fully proven (ok) result. Other outcomes have visible labels or reasons:
| Outcome | How to use it |
|---|---|
Proven (ok) |
No status banner appears. The result landed without an assumed library step or a frontier; it remains limited to modeled language and library facts. |
| Assumed | The app says “Landed · assumes library code.” Read “Assumed library steps” in the inspector. A trace that also has a stop is labeled partial. |
| Partial | The app says “Partial: some paths stop at frontiers.” Inspect the frontier rows and locations before drawing a conclusion. |
| Stale | The app says “Source changed. Refresh.” Rebuild the graph from the current sources before using it. |
| Unsupported | The analysis names why it could not trace the selected anchor, such as “Nothing to trace.” Treat this as an analysis limit. |
| Stopped at budget | The app names the budget limit. The trace stopped before covering the full requested slice. |
| Not analyzed | The app says “Data flow N/A” and gives a reason such as Node.js not found or a timeout. Do not treat it as zero edges. |
The engine's graph is not a whole-program proof. It models selected language constructs and libraries. An empty graph, a missing edge, or a partial path does not prove that a value cannot flow. Check assumptions and source locations, then verify important conclusions in code and tests. See Design decisions for how Srcly keeps modeled data flow separate from imports.
A review sequence
- State the path or symbol you want to investigate.
- Pick a route or anchor that corresponds to that question.
- Follow the graph and inspect the source behind each key edge.
- Read the outcome, assumptions, and terminal or stop locations.
- Confirm important behavior against source and tests.
- If the trace is unavailable, decide whether the reason can be fixed through setup or reflects an unsupported case.
This keeps a plausible graph from becoming a stronger claim than its evidence supports. For other views, see Explore. For checker coverage and findings, see Findings.