Srcly is designed for one practical loop: orient yourself in a codebase, choose a useful signal, inspect the code behind it, and decide what to do next. The browser keeps those steps connected. The CLI makes a similar investigation repeatable for scripts and coding agents.
1. Start with the shape of the repository
Run Srcly from a repository:
uvx srcly
The app opens in your browser and serves the local repository through a local web server. Keep the terminal open while you work. Use the path bar to choose a repository, then select Analyze. The first scan reads files and reports progress. Unchanged analysis can be reused from the local cache on a later visit.
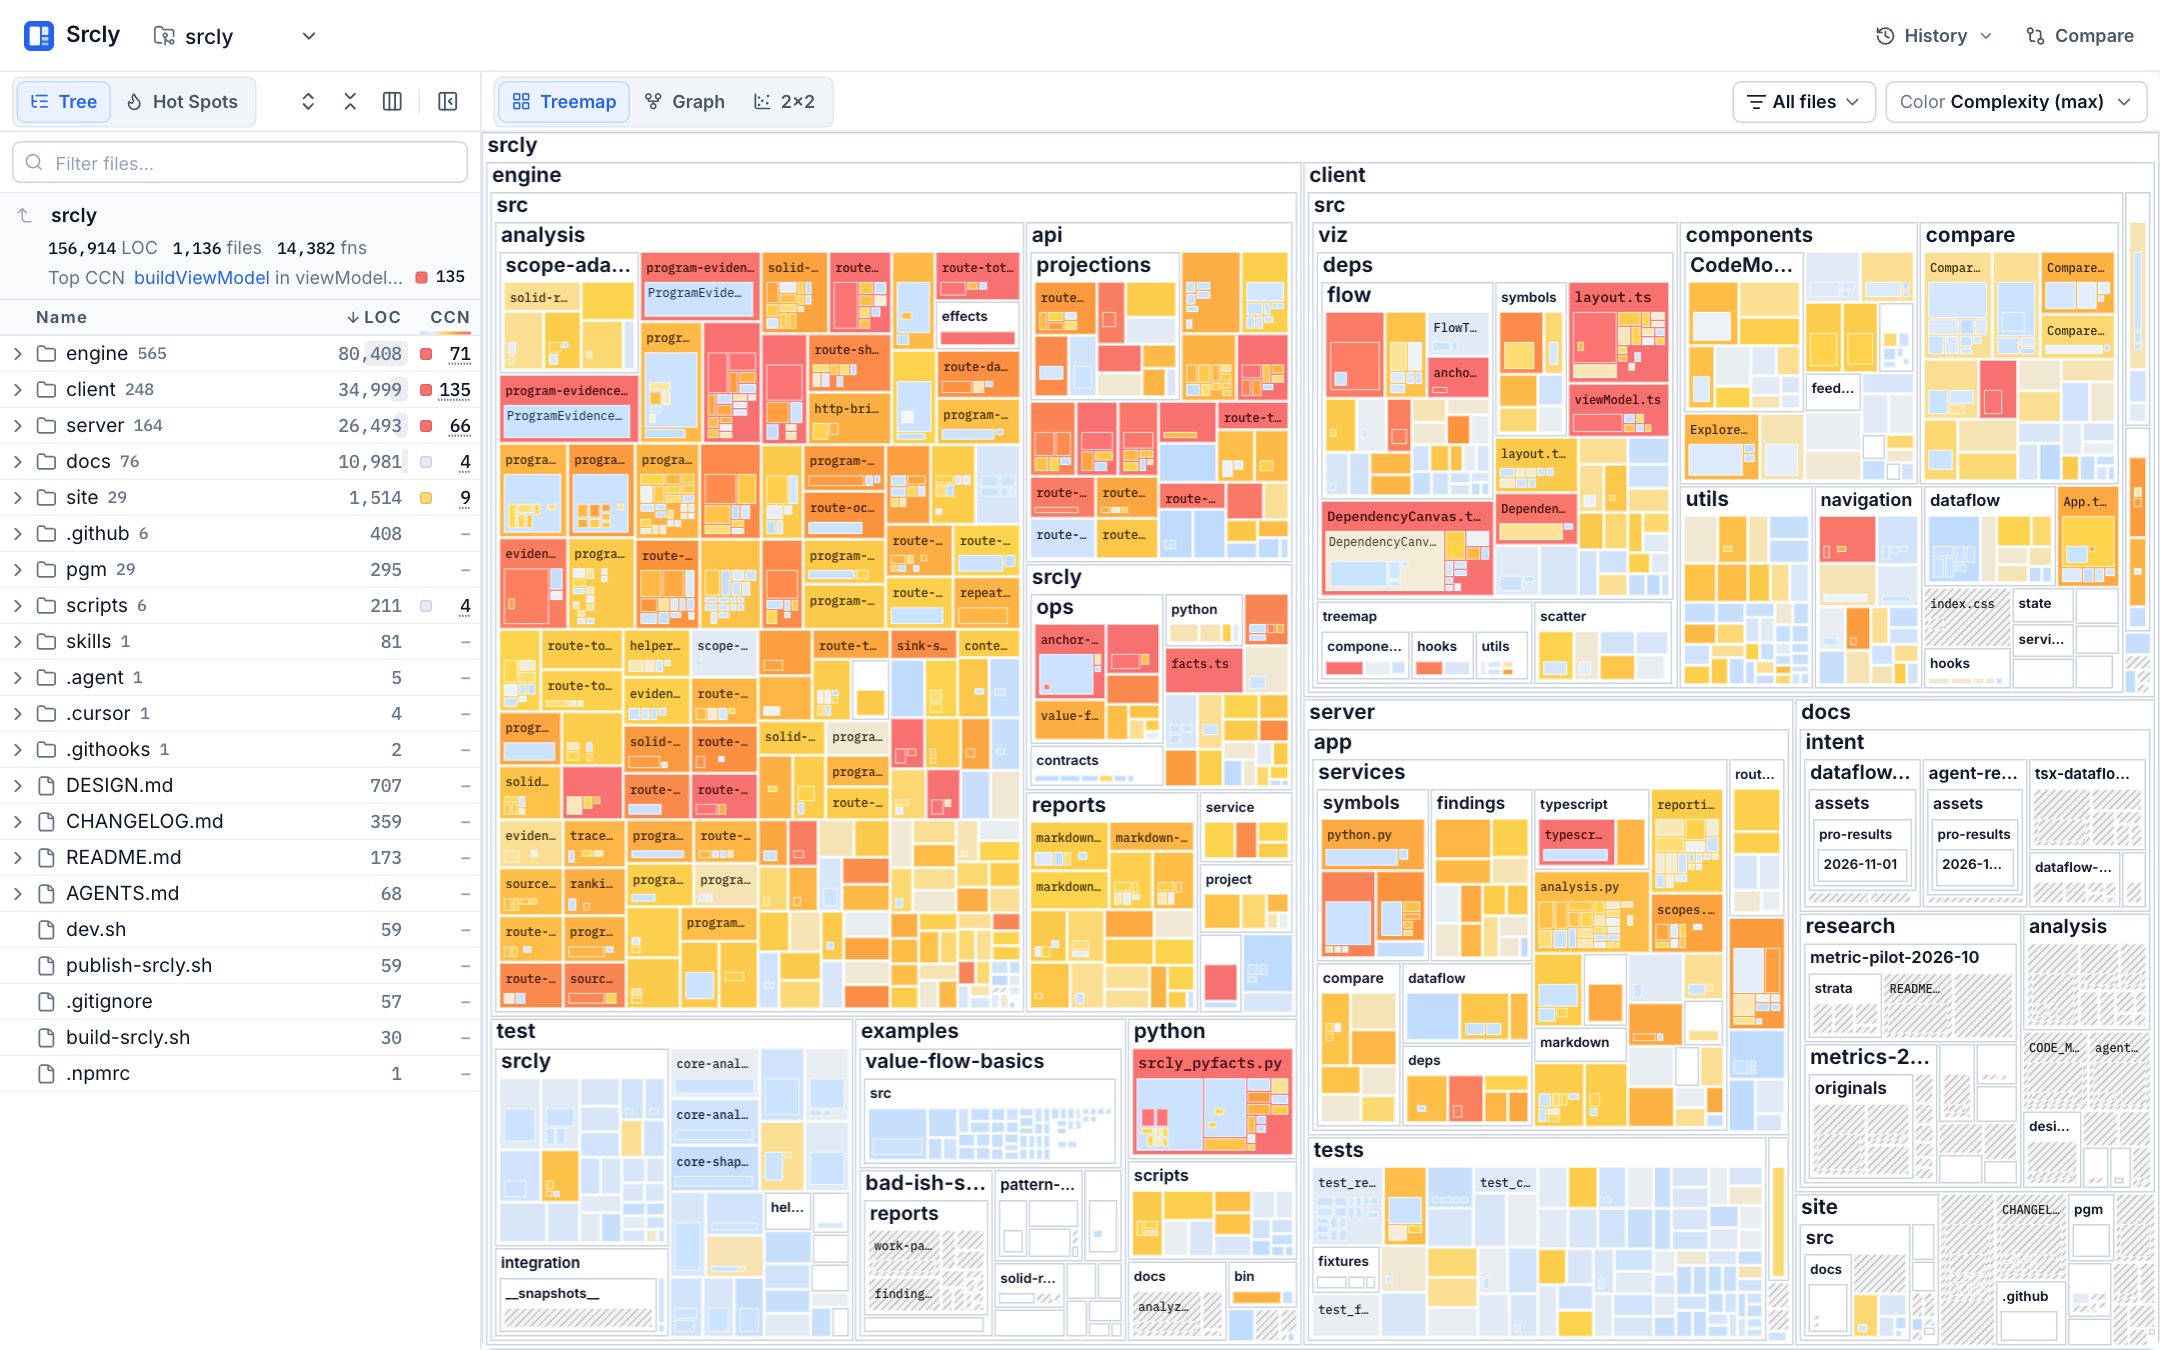
The treemap provides the broad view. Folders contain files, and files can contain functions and nested scopes. Tile area represents lines of code; color represents the selected metric. Start by asking a specific question, such as “Which files have the highest complexity?” or “Where does this component concentrate its logic?”
2. Choose a signal that matches the question
Choose a metric in the view controls. Complexity can help locate branching-heavy functions. LOC can show where code is concentrated. Component metrics can help inspect React or Solid component shape. Git activity can add historical context when repository history is available.
Open Hot Spots when you want a ranked list, or use the 2×2 view to compare two supported metrics. A ranking is relative to its cohort and selected metric. A high value identifies a place to inspect; it does not diagnose a defect. For definitions and aggregation rules, see Understand metrics.
3. Inspect the source and its witness
Select a file or function tile, or select its row in the explorer. Srcly opens the source with available metrics, findings, and line evidence. For an aggregated value, check which rule produced it. For maximum complexity, Srcly carries the function that sets the maximum as a witness. For a checker result, read the tool, rule, location, and message.
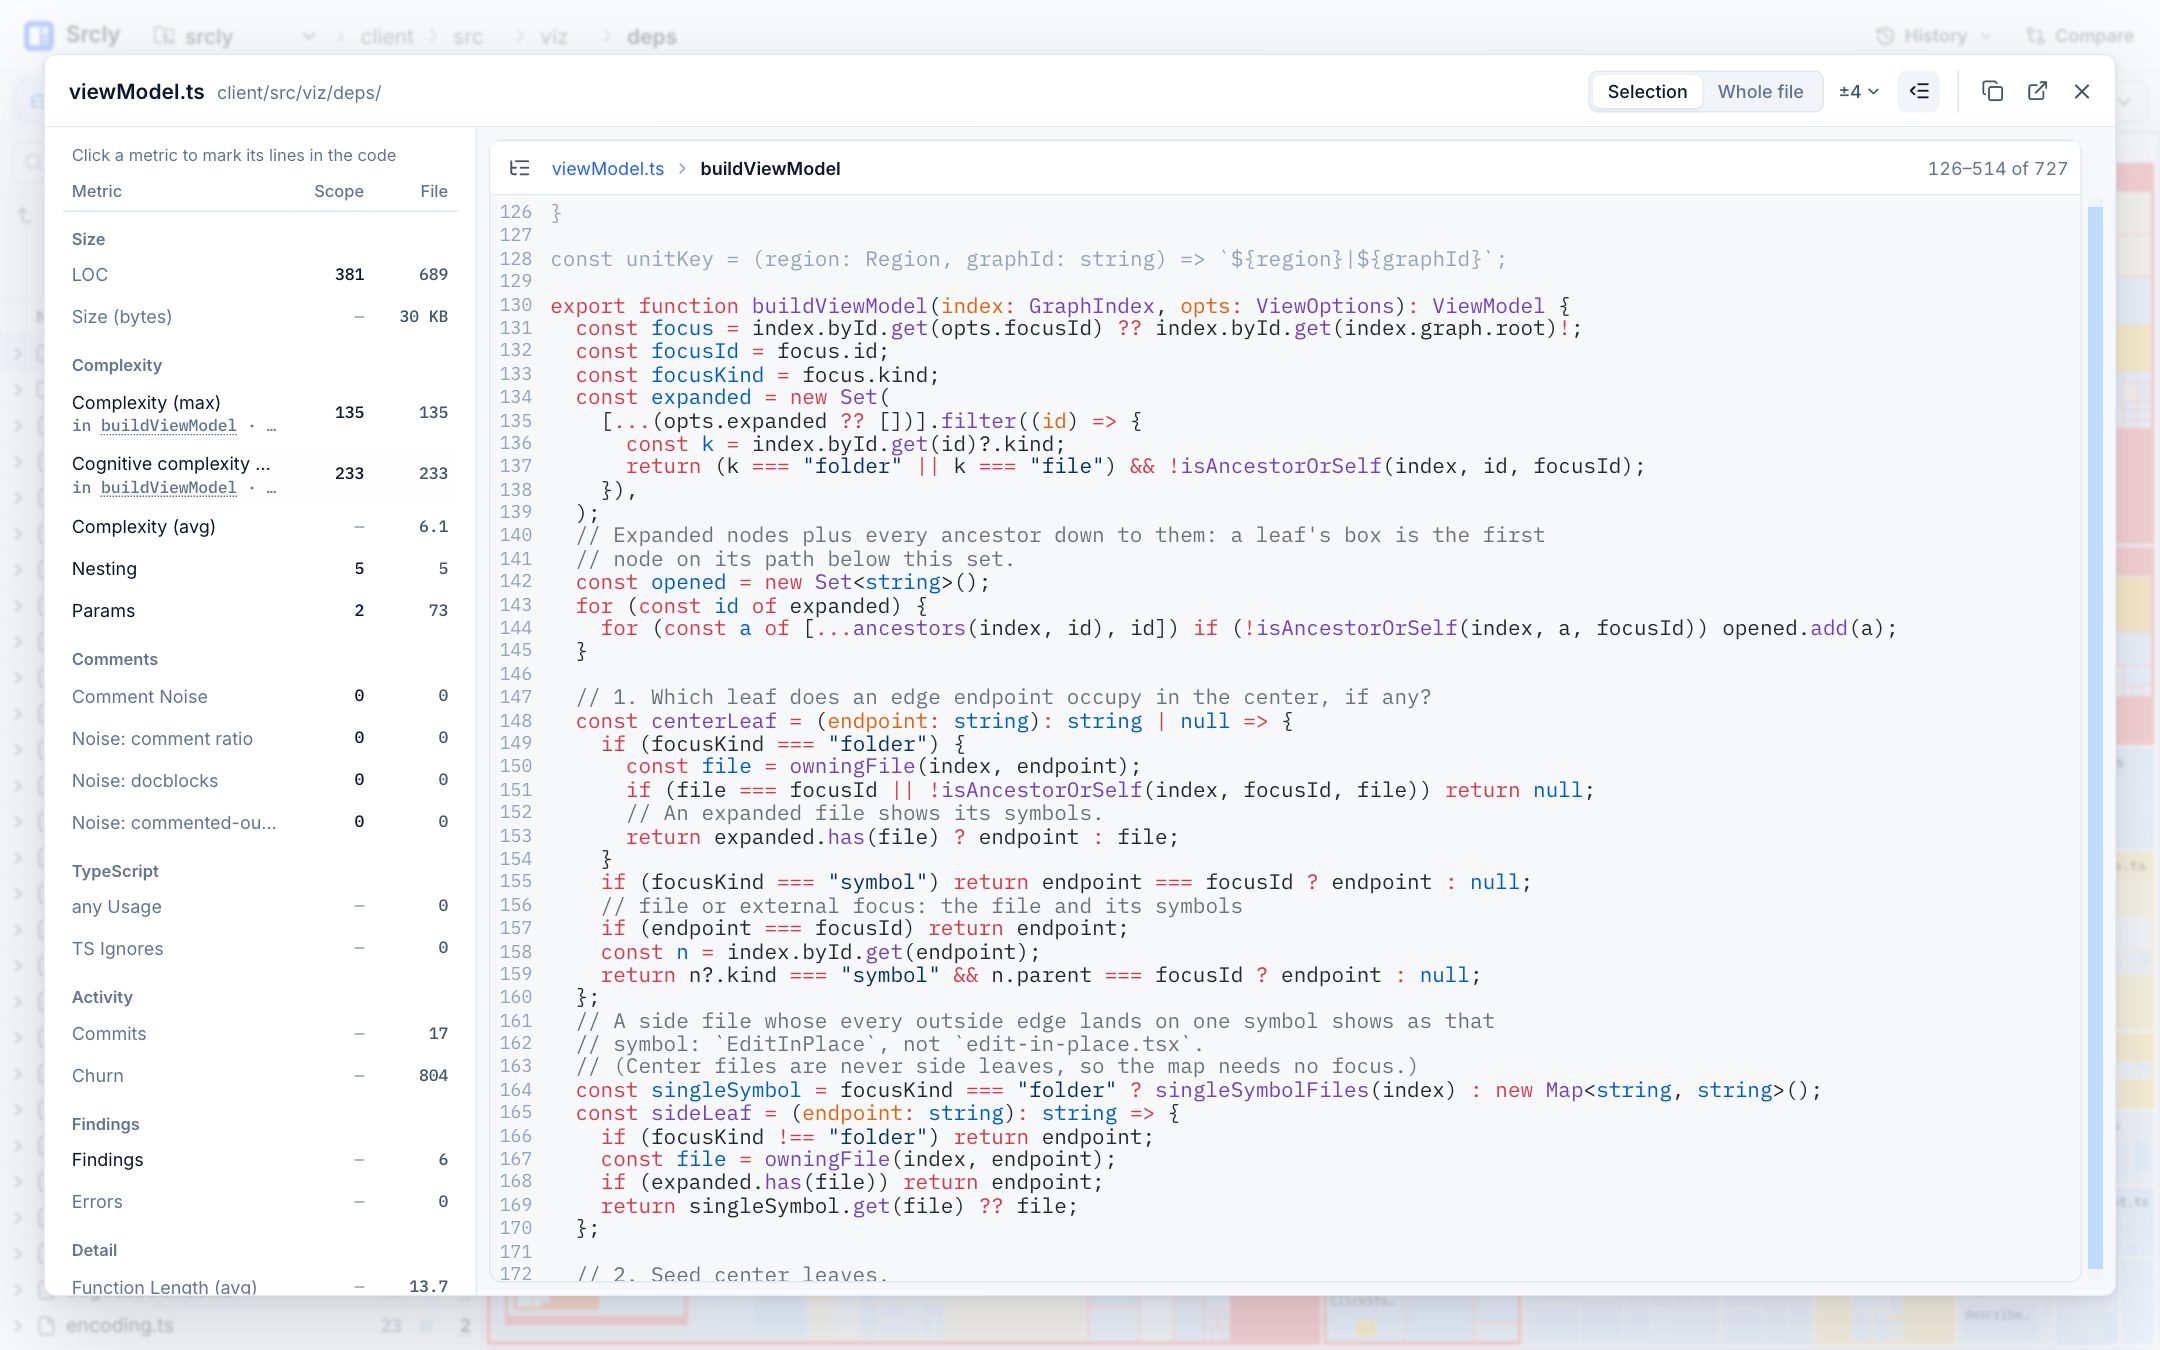
Ask what the evidence supports. A complexity value describes branching structure. A checker finding reports what that checker detected under its configuration. Neither says whether a change is needed. Read the relevant code, then confirm a suspected issue with the project's tests or checker.
4. Follow a relationship when the question needs it
Use the dependency graph to inspect TypeScript and TSX import relationships. It answers which modules import or use other modules. It is not a call graph and does not show where a particular runtime value goes.
The graph also has Symbols mode for symbol-level references. It centers one symbol, shows referrers on the left and referenced symbols on the right, and frames the focus by file and class. Press / to find a symbol. Select a box to inspect references and source lines. Shift-click a box or press E to open that symbol's hop in place. Kind filters and the Tests control help narrow the view. These are static references; check the displayed resolution and source locations before treating a link as exact.
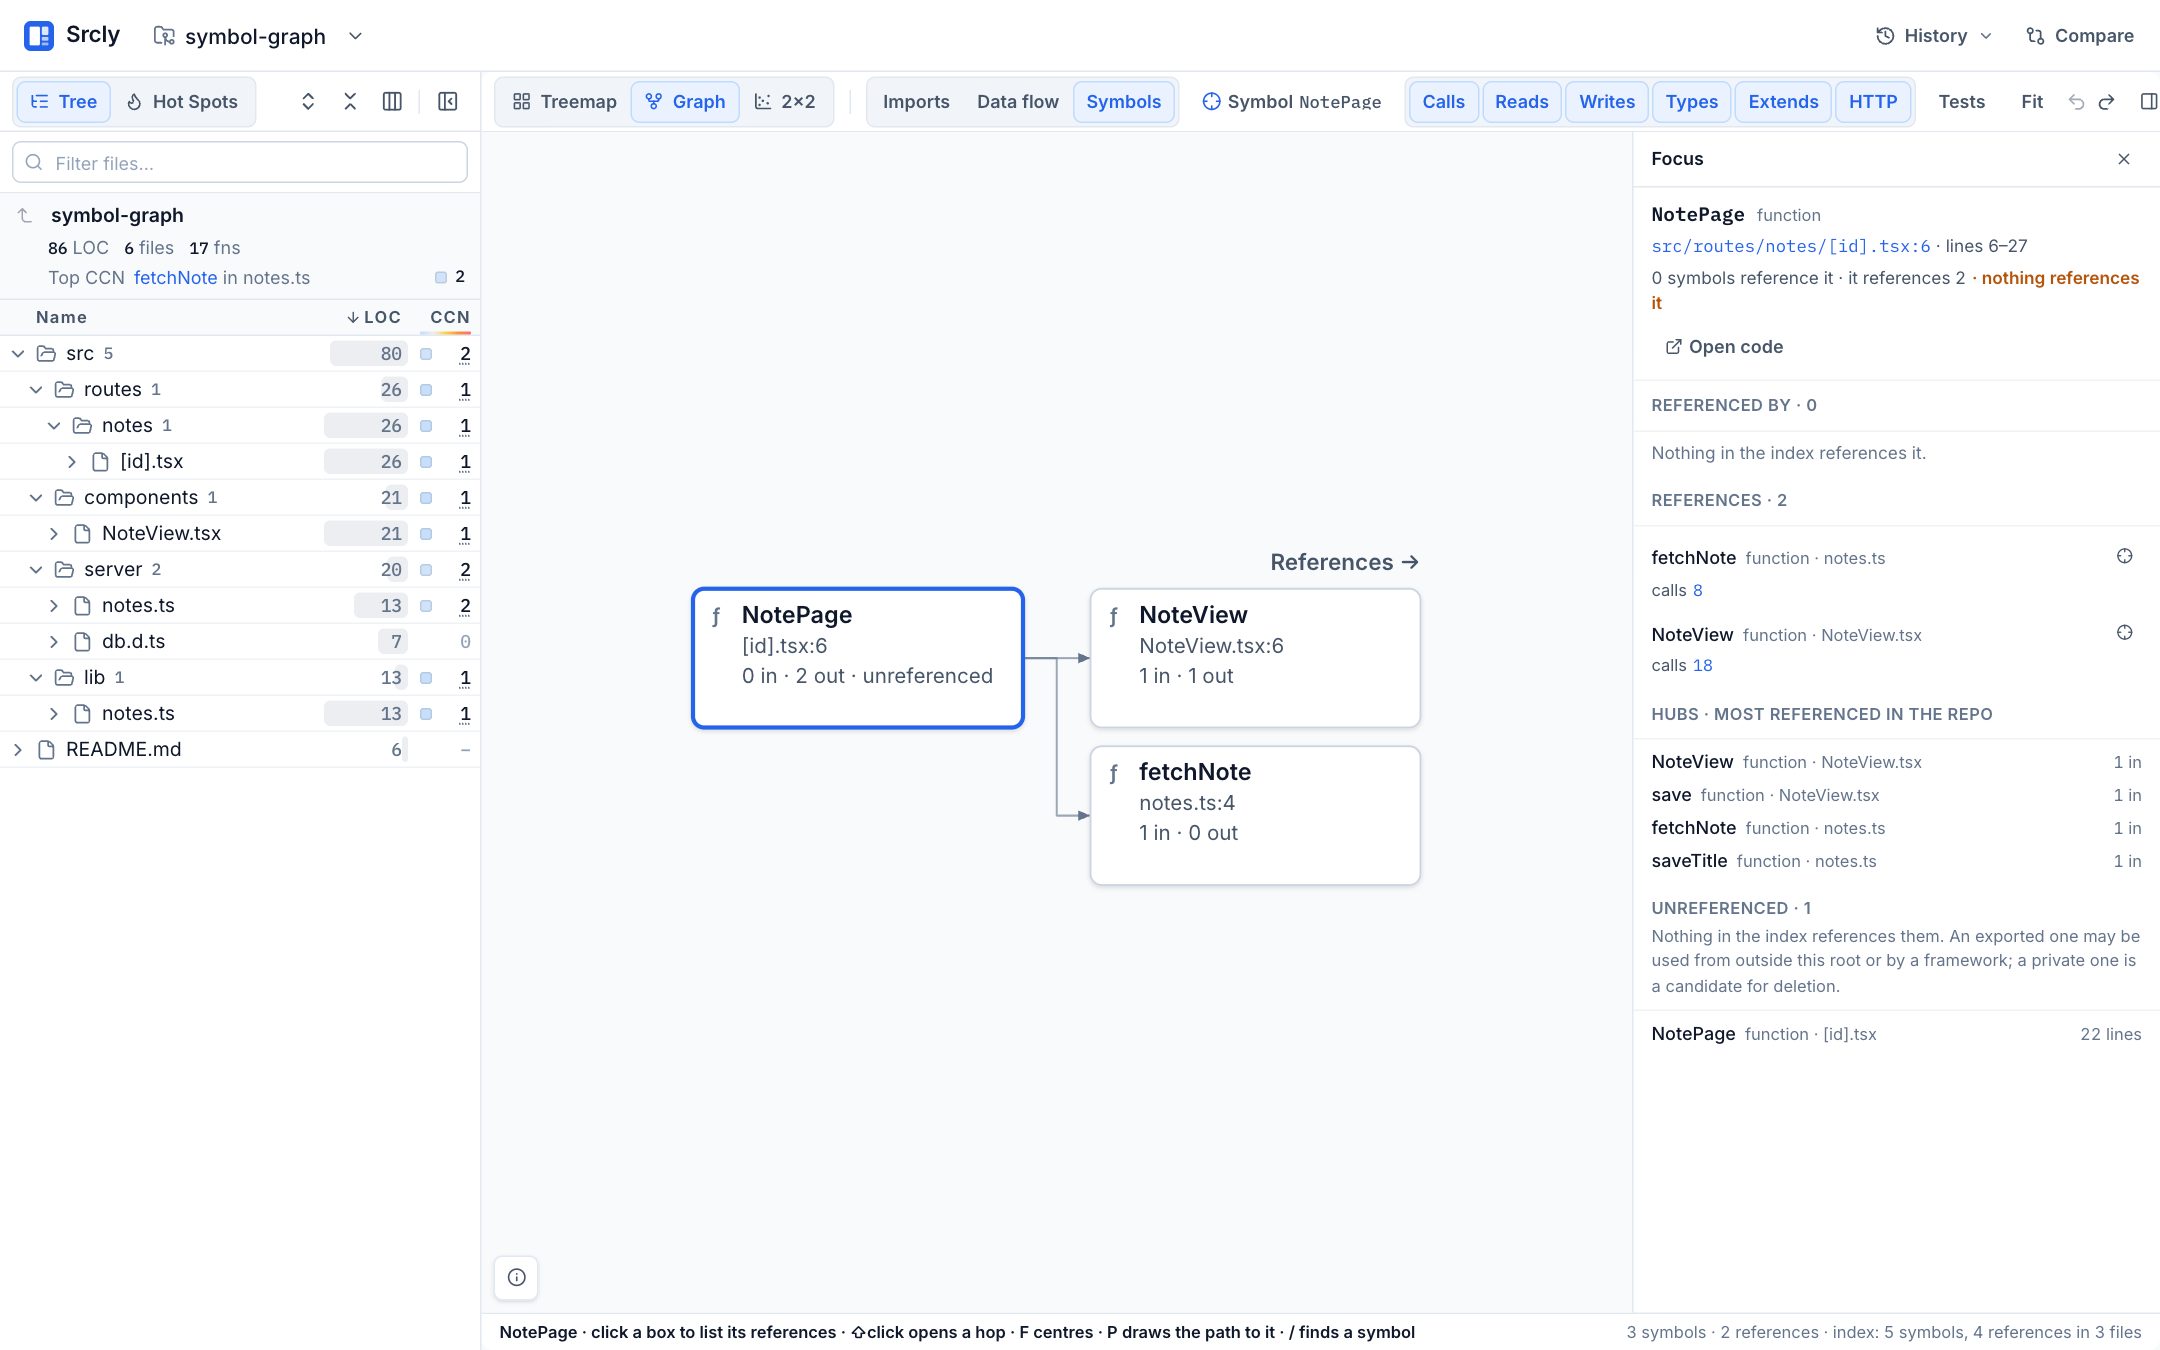
NotePage and shows its references to fetchNote and NoteView. The inspector provides source locations and reference counts.Use Data flow when you have a supported route or symbol and want to follow modeled values, function effects, or route handling. Select a file or function, open Data flow, and choose an anchor available for that code. Inspect graph items and their source locations. For a route or value path, read the outcome and any assumptions or stops before drawing a conclusion. The bundled engine requires Node.js 18 or newer. See Data-flow analysis for language limits and outcome meanings.
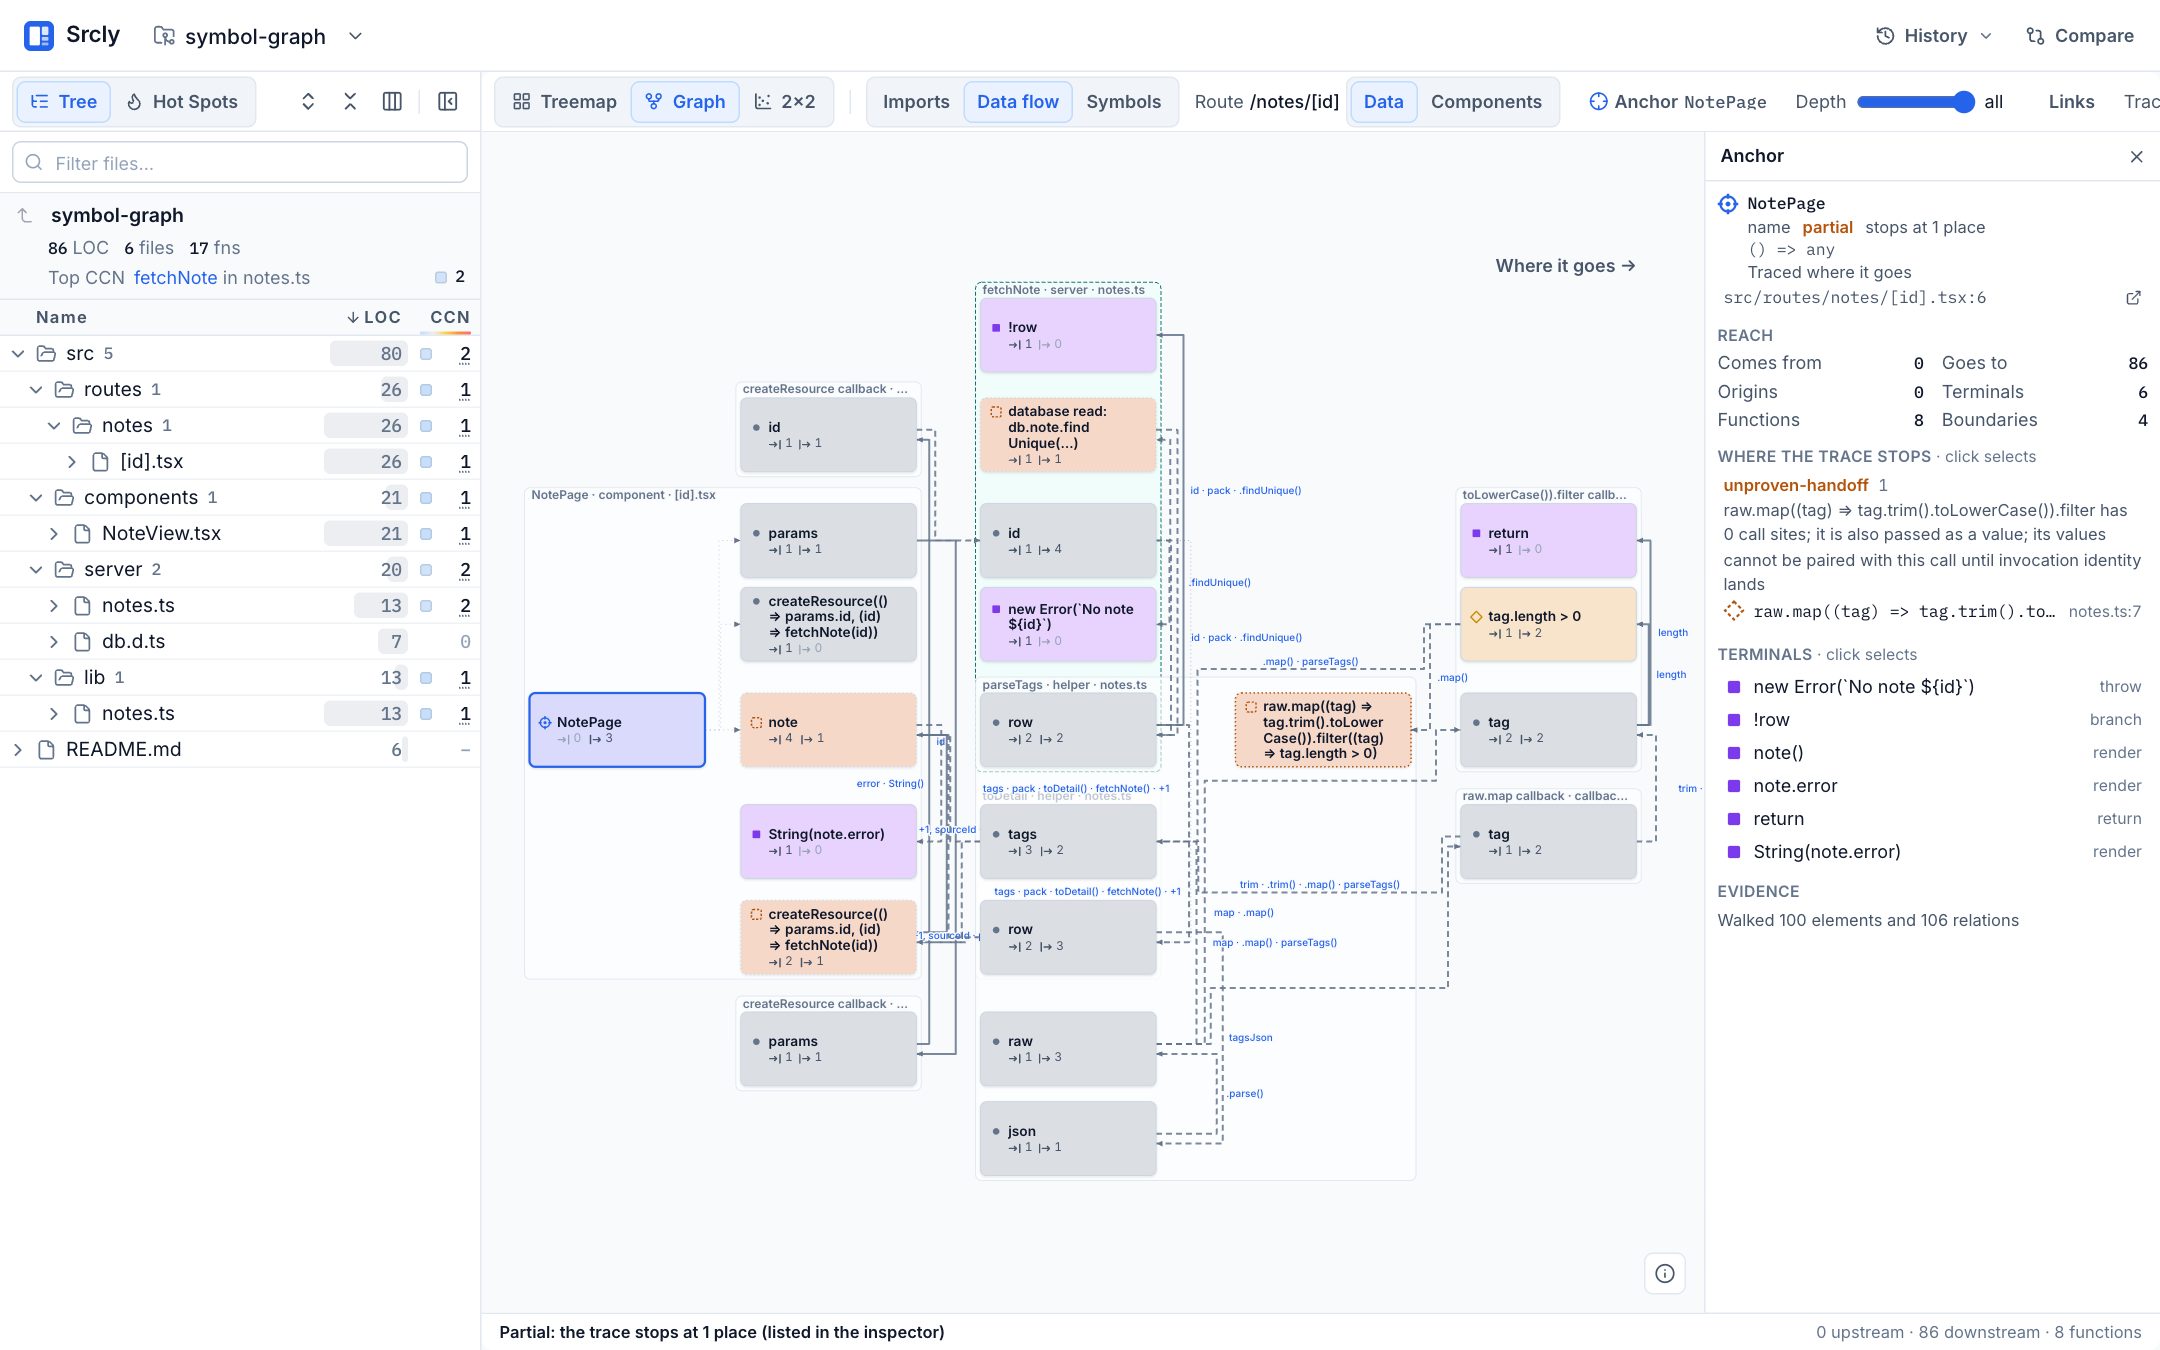
/notes/[id] route trace in the included symbol-graph example is anchored at NotePage. It is partial: one callback handoff has no call sites to pair its values. Inspect the unproven handoff before relying on the path.5. Review what a session changed
After a coding session, select Changes and pick This branch, 24 hours or 7 days. The map shows only the functions, sections and line ranges that the window edited, grouped by folder and file. Tile area is changed lines, so one edited handler in a 2,000-line file gets the footprint of that handler. The panel lists what to review first by plain rules: chunks that were already complex and changed, and chunks that crossed the complexity line. Select a chunk to see its before → after values and the commits that touched it, then open its diff.
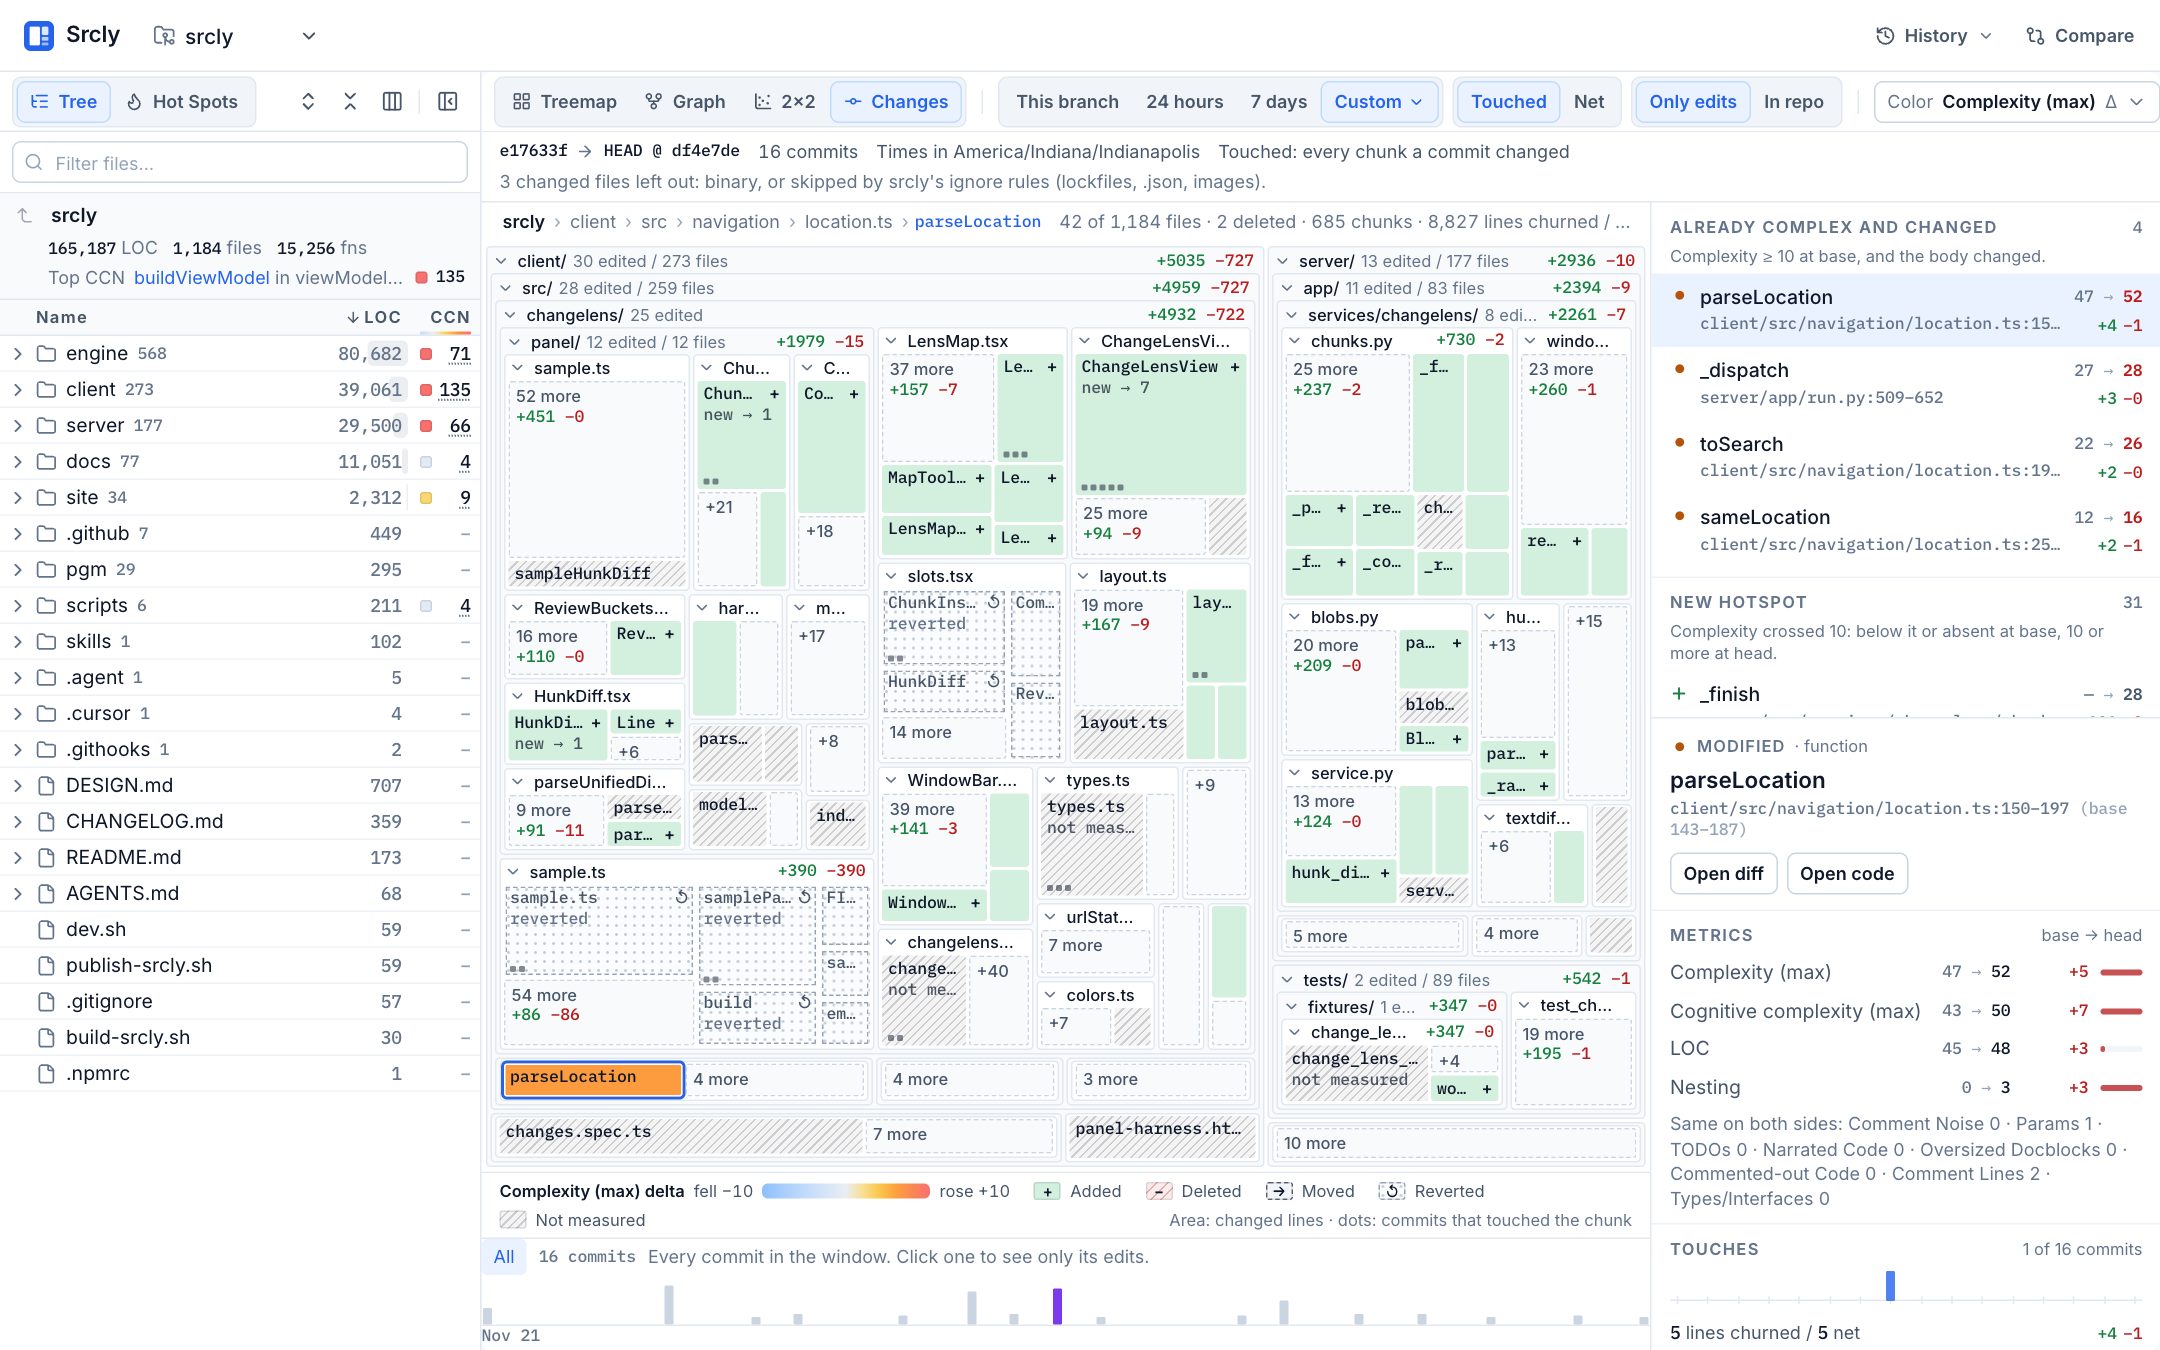
parseLocation went from complexity 47 to 52 and leads the review list.Switch Touched to Net to drop work that was tried and put back. See Review changes for the window and chunk rules.
6. Repeat the investigation in a terminal
If you need a saved review or want to pass evidence to an agent, run:
uvx srcly report . --out .srcly
uvx srcly explain . --at path/to/file.ts
Read report.md first, then follow its suggested scope into explain. The generated Analysis: line records whether the scan was reused or fresh, the Git revision and working-tree state, checker coverage, and analysis failures. It helps distinguish a measured result from a gap in coverage. See Reports for artifact-to-question mapping.
Make the next decision
The first review should end with a decision, not just a list of high values. You might verify a finding, add a missing checker, adjust a TypeScript entry glob, or defer a refactor because the evidence is weak. Keep the signal and its coverage with that decision. If a result is unavailable, use its reason to decide whether to configure a tool or accept the gap.
Start with Get started for installation details. Use Explore to compare the views, or Findings to understand checker coverage.