Srcly combines a visual code map with source-level evidence and repeatable terminal output. Its design follows a simple review path: orient, select a question, inspect the evidence, and decide what to verify. This page explains the choices behind that path and where they set limits.
Two evidence trails
At revision 653037aa, Srcly scanned its own public client/src tree: 236 files and 33,823 LOC. Hot Spots ranks 235 measured files; viewModel.ts::buildViewModel leads at CCN 135. The inspector opens App.tsx::openAt with source and metrics. Together, these screens support a product choice: move from map to ranked candidate to source witness. They show how the review works, not a measured improvement. The capture record names the source and revision.
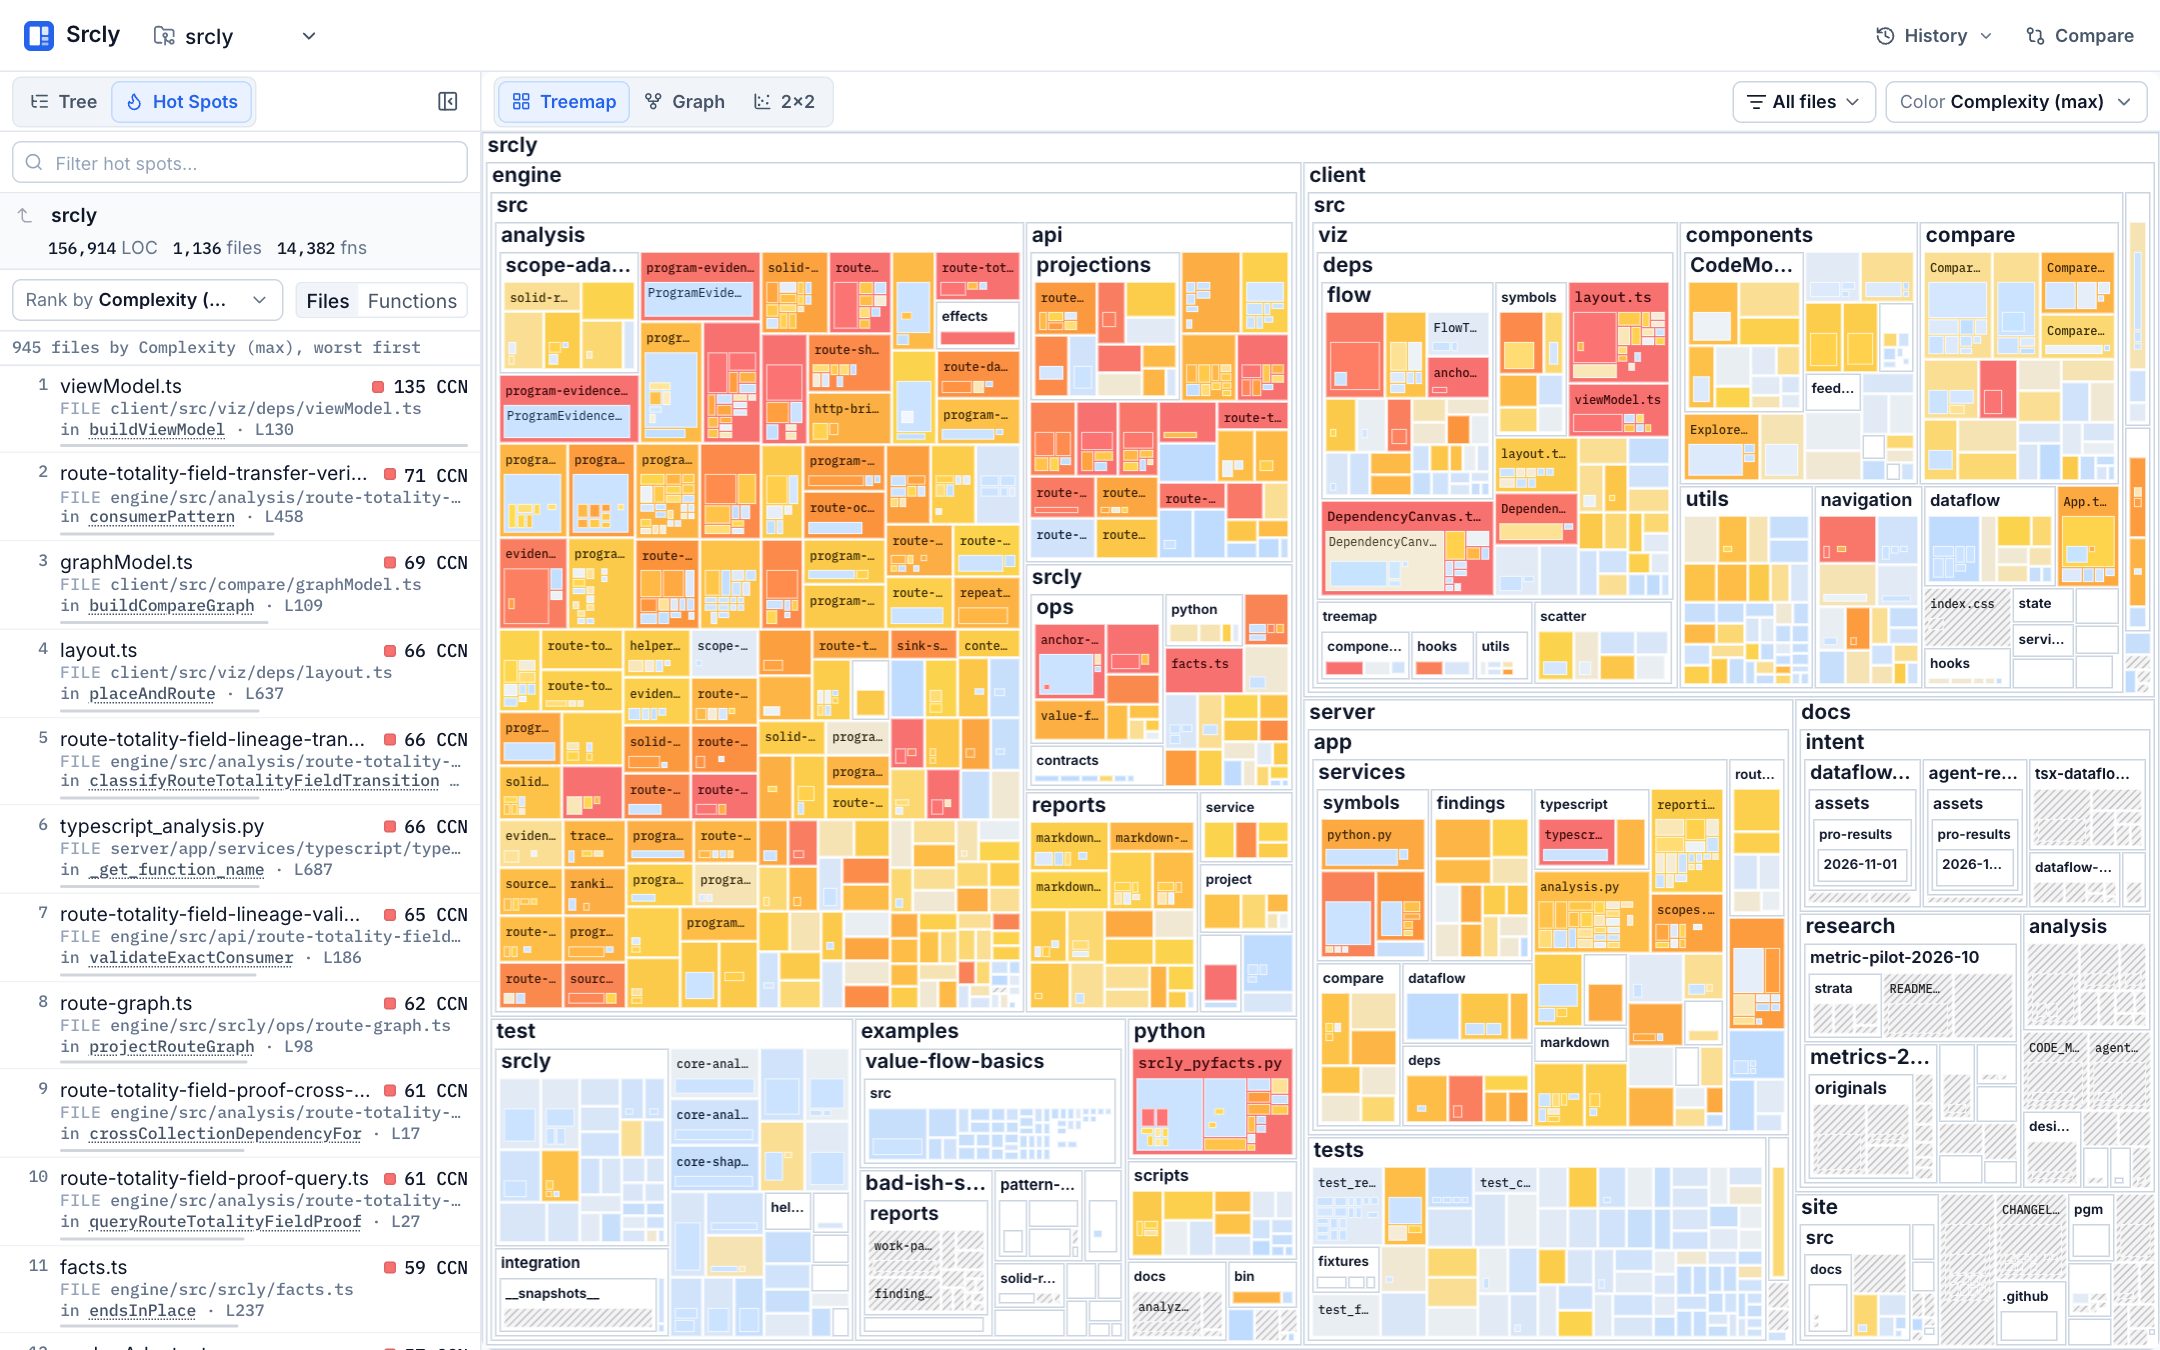
e4485453: 1,136 files, 156,914 LOC, and a top measured complexity of CCN 135 in viewModel.ts::buildViewModel.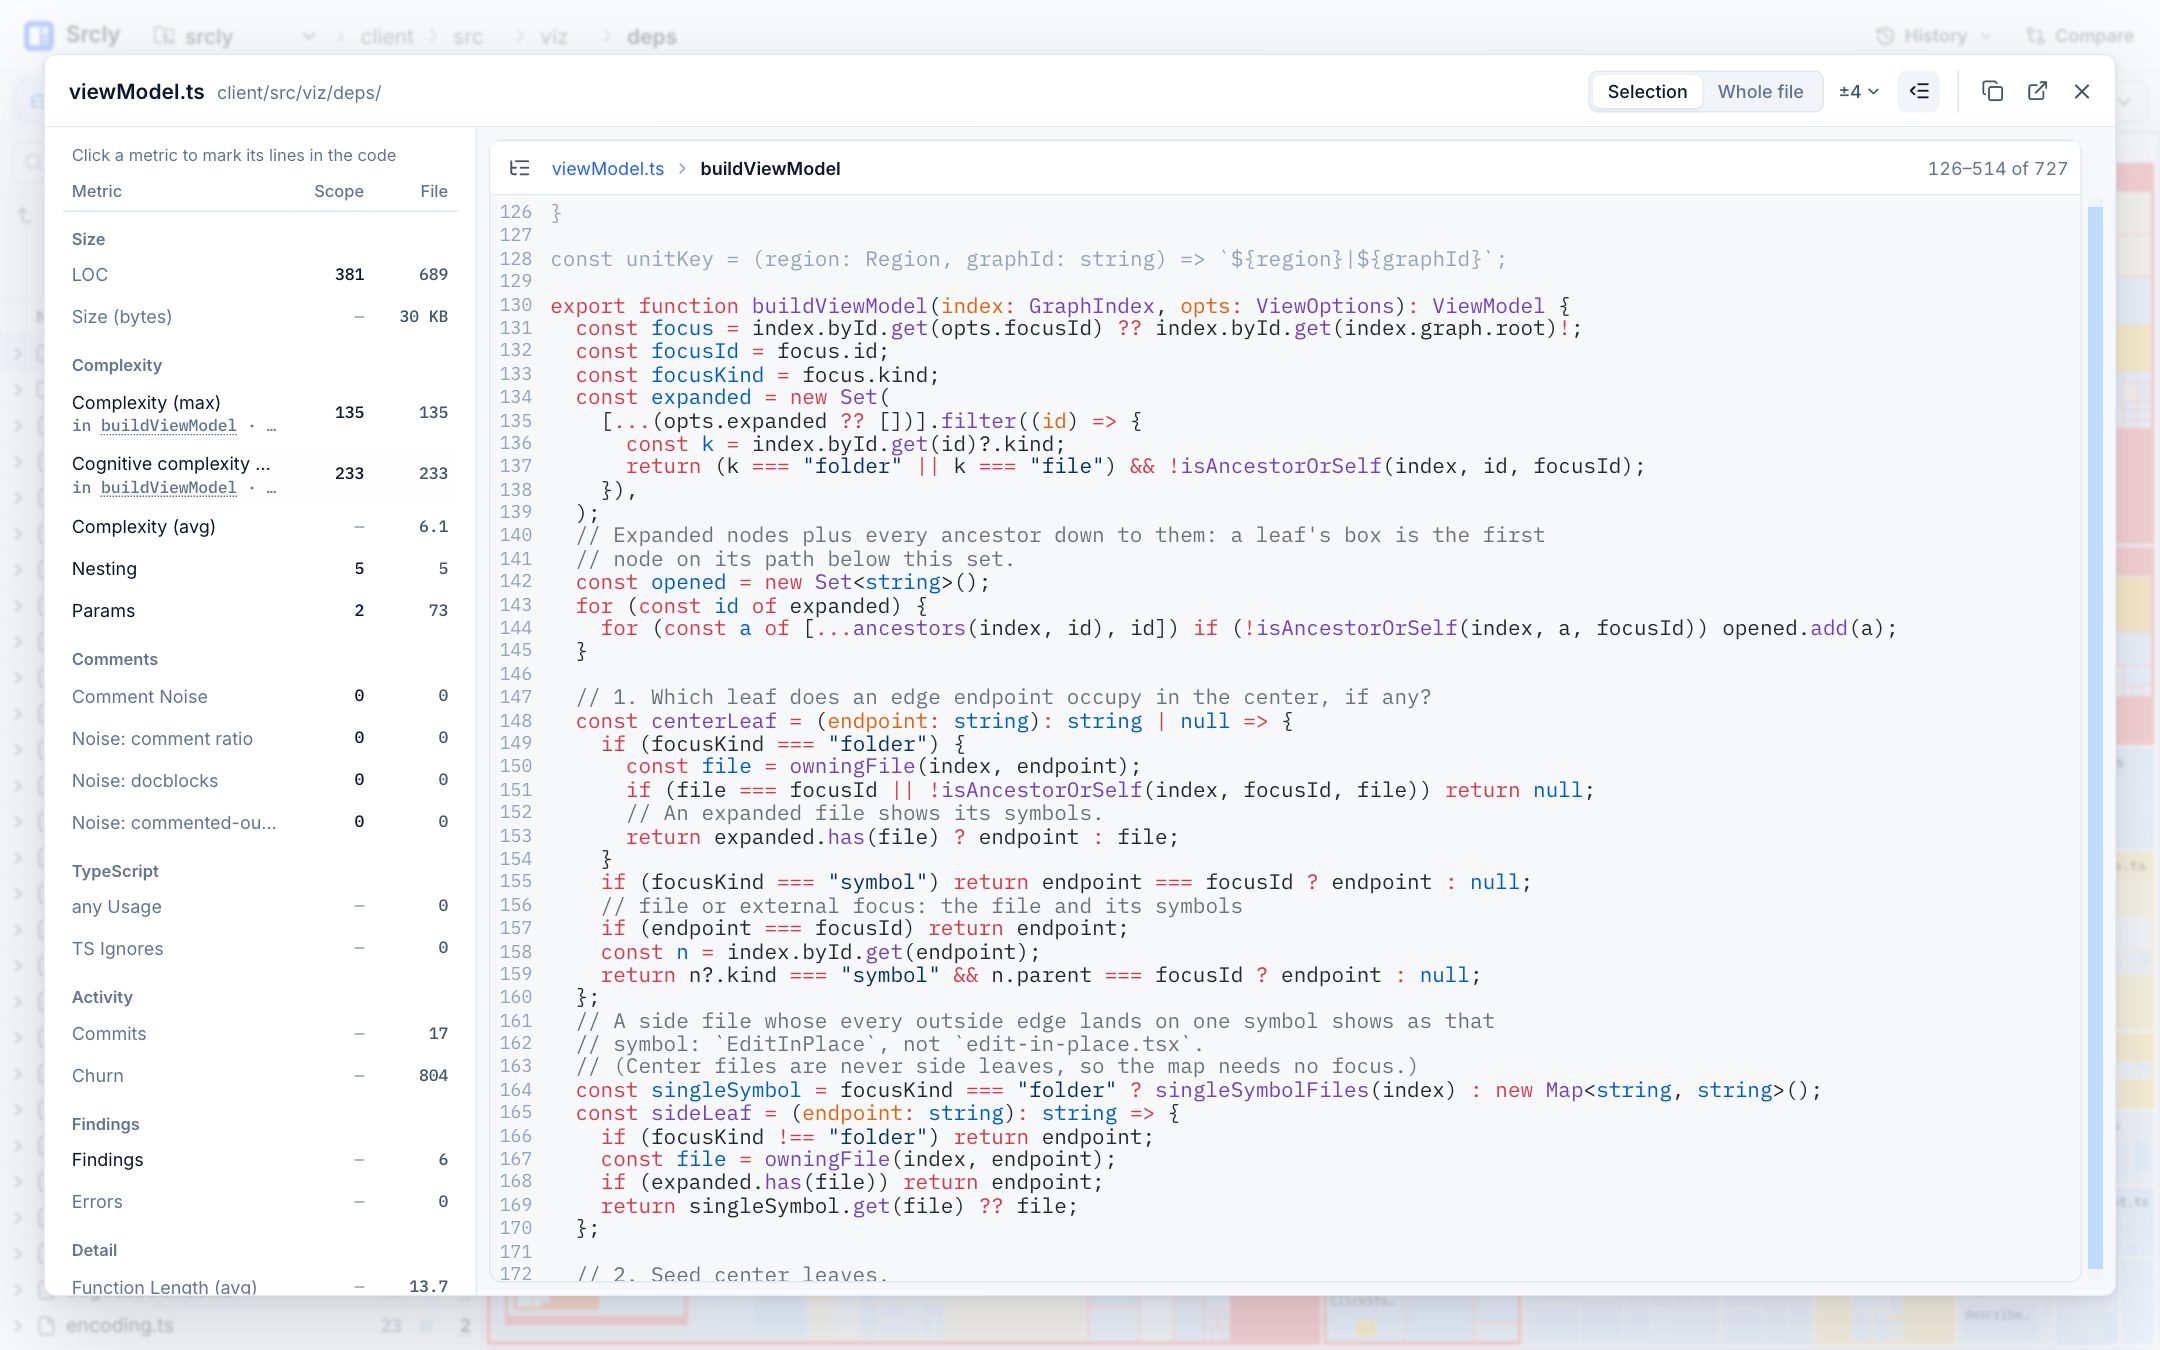
viewModel.ts::buildViewModel with source and metrics. It demonstrates the next step after a ranked signal: inspect the code and its evidence.A separate report on the included engine/examples/solid-route fixture at the same revision, 653037aa, returns five findings with --limit 5 across 10 code files. The first row points to src/data/records.ts::isRecordItem (complexity 8, 24 LOC). Inspect its branches and nearby tests; change it only if a test-backed, behavior-preserving simplification is clear. The fixture source is a different corpus from the client screenshots. Reproduce the report with Reports.
This case gives the CLI a matching role: create a bounded queue, name its evidence, and leave the final decision with the reviewer. The agent-reporting plan describes the emphasis on freshness, provenance, and coverage.
Start with a local view of the codebase
Srcly runs as a local command and opens a browser app served from the local process. It reads the repository you choose, follows Git ignore rules, skips common generated and dependency directories, and caches analysis in the user's cache directory.
The map provides orientation; the code viewer connects a selected node to its source. The CLI saves a report for terminal or agent review. Both workflows expose evidence and its coverage.
Keep the tree granular enough to inspect
The analysis tree mirrors folders and files, then adds detected functions and nested scopes. Leftover lines inside parent scopes become body fragments, so nested scopes do not double-count area. Folder and file values roll up according to each metric's rule. The code map points to the tree builder and aggregation code.
Granularity creates a navigation trade-off. A repository-wide tile is useful for orientation; a function tile is useful for inspection. Linked views let you move between those scales. See Explore and Metrics.
Preserve unavailable evidence as unavailable
An unavailable metric is not zero. A missing, failed, or timed-out checker did not report a clean result. A TypeScript-only metric does not apply to another language. Srcly keeps these cases separate and gives a reason where it has one. Comparisons separate coverage changes from measured deltas.
This prevents missing analysis from looking like improvement. Rankings can use different evidence for different files, so check coverage before comparing them. Configure a missing checker or accept the gap. See Metrics, Findings, and the agent-reporting plan for freshness and provenance decisions.
Use the right relationship for the question
The TypeScript and TSX dependency graph shows imports. Data flow traces modeled values, function effects, or supported routes. An import edge does not prove value movement; a data-flow edge is not a general runtime trace. The engine design and logic visibility brief explain the boundary.
Symbols mode shows which functions, classes, fields, or types reference a symbol. Edges carry a resolution label: exact, typed, or name-based. This gives more detail than imports without claiming value flow. See the symbol graph brief.
Data flow is optional. It runs through a bundled engine that requires Node.js 18 or newer. The engine's results carry outcomes and provenance, including partial, assumed, stale, and unavailable states. The rest of the scan does not depend on that engine. This keeps the base map usable when the optional analysis cannot run. Read Data-flow analysis before relying on a trace.
Keep review signals separate from decisions
Metrics describe code structure; findings report checker output; Git activity describes history when available. A profile or Hot Spots ranking helps choose where to look, but it does not prove quality, safety, or maintainability. Review the source and confirm what matters for the project.
The same rule shapes the agent workflow. Reports include structured artifacts, metric definitions, checker coverage, and an analysis provenance line. Scoped explain output keeps the next question bounded. The artifacts are evidence for review, not instructions to refactor blindly.
What these choices cost
Local analysis means the user runs the command and keeps the server process open while using the app. Language-specific measurements have different coverage. Data-flow analysis needs Node and may stop at unsupported constructs. The visual map is a navigation aid, not a substitute for tests, type checks, or runtime behavior. Reports can be reused from cache, so the Analysis: line matters when deciding whether to refresh.
Start with Get started, then use Reports to check provenance or Configuration to address supported setup gaps.