Srcly helps you move from a broad view of a repository to the exact code behind a signal. It runs on your machine, maps folders, files, functions, and nested scopes, then links metrics and selected checker results to source. You can explore in the browser or create scoped reports for a terminal, an agent, or CI.
- Discover Srcly: Product tour and Design decisions.
- Use Srcly: Get started and Reports.
Choose your path
If you want to try Srcly
Start with Get started. Launch the app, analyze a repository, and complete one short review: choose a metric, inspect a high or unexpected value, and check the source behind it. Then follow Explore the views to compare the treemap, explorer, Hot Spots, 2×2, and graph views.
If you want to understand the product
Read the Product tour for the main workflow and the Design decisions for the choices that shape it. Srcly combines a visual map for human navigation with CLI reports for repeatable review. It treats unavailable evidence as unavailable, and keeps import relationships distinct from modeled value flow.
If you are reviewing code
Use Metrics to learn what a value measures and how a folder value is aggregated. Use Findings to check which tools ran and what they reported. Use Data-flow analysis when you need to trace a modeled value through supported code. Rankings and traces help direct review; they do not establish that code is defective or safe.
If you are automating a review
Start with Reports for agents and CI, then use the Command-line reference for flags. A report includes Markdown and machine-readable artifacts. explain lets you investigate a repository, folder, file, or symbol without loading the full tree into your prompt. Read the analysis and coverage information before acting on results.
What Srcly does
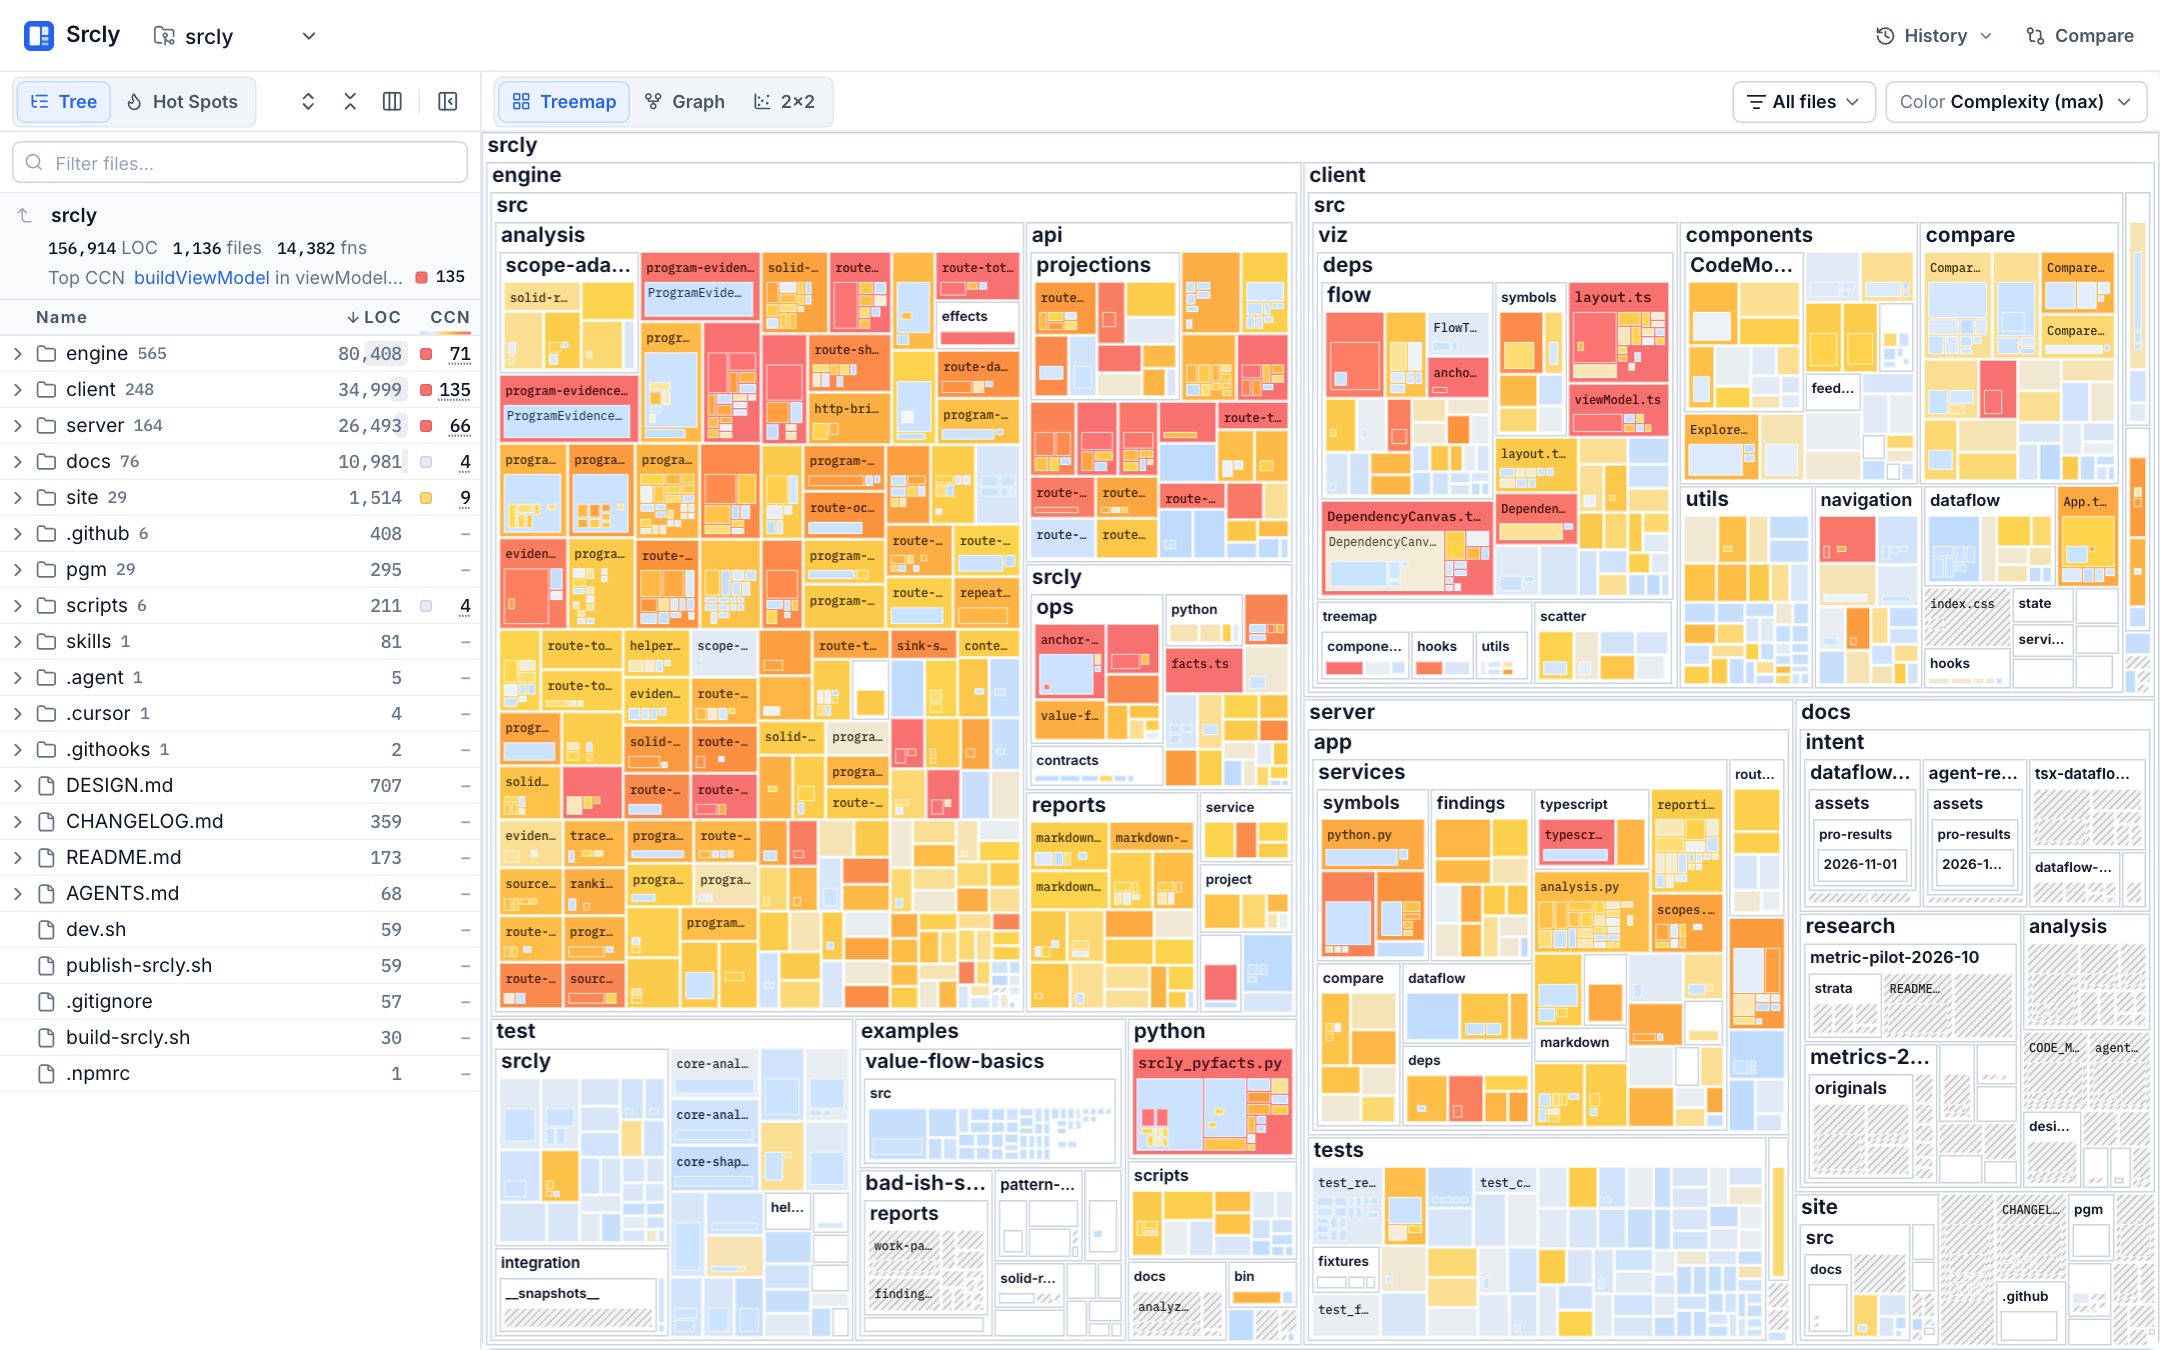
Run uvx srcly from a repository to open the local app. The treemap gives a spatial overview: area represents lines of code, while color represents the selected metric. The explorer, Hot Spots, and 2×2 views offer other ways to sort or compare the same scan. Select a file or scope to open source and supporting evidence.
The scan uses Lizard for broad source coverage and language-aware analyzers for richer signals where supported. Metrics vary by language and node. A metric can be zero, or it can be unavailable because it does not apply or could not be measured. Srcly keeps these states separate and reports reasons where available.
For a repeatable terminal workflow, run:
uvx srcly report . --out .srcly
uvx srcly explain . --at src
The report gives you an overview and artifacts. explain narrows the next question to a folder, file, or symbol. Both commands share the analysis cache. See Reports for artifact meanings and CLI for supported scopes and options.
What Srcly does not claim
A large file is not automatically a problem. Complexity is not a quality score. A checker finding is not a confirmed defect. An empty or partial data-flow result does not prove that a value cannot reach a destination. Use each signal to decide where to inspect, then verify the claim against source and the tools your project trusts.
Data-flow analysis is optional and requires Node.js 18 or newer. Without it, the rest of Srcly remains usable and the unavailable result has a reason. Import graphs and data-flow graphs answer different questions; see Design decisions for why they stay distinct.
Continue
- Get started — launch Srcly and complete your first review.
- Product tour — follow one workflow from map to source evidence.
- Explore — choose a view for a review question.
- Reports — produce artifacts for agents and CI.
- Configuration — set roots, entries, optional checks, and environment variables.